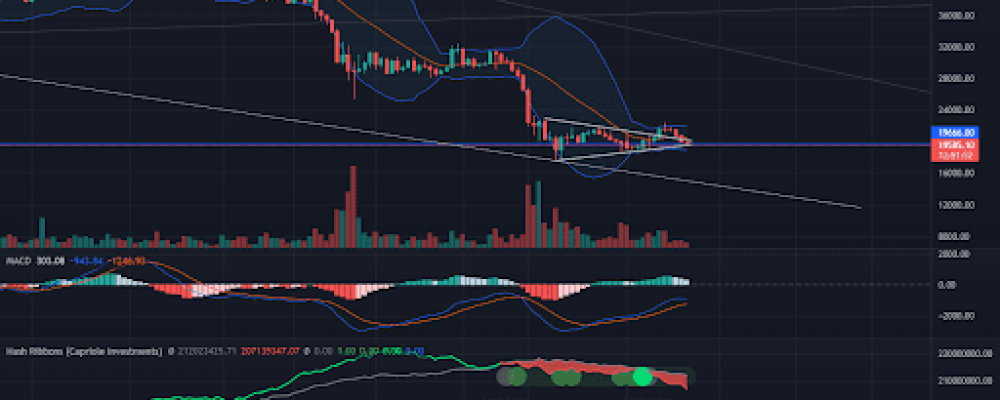
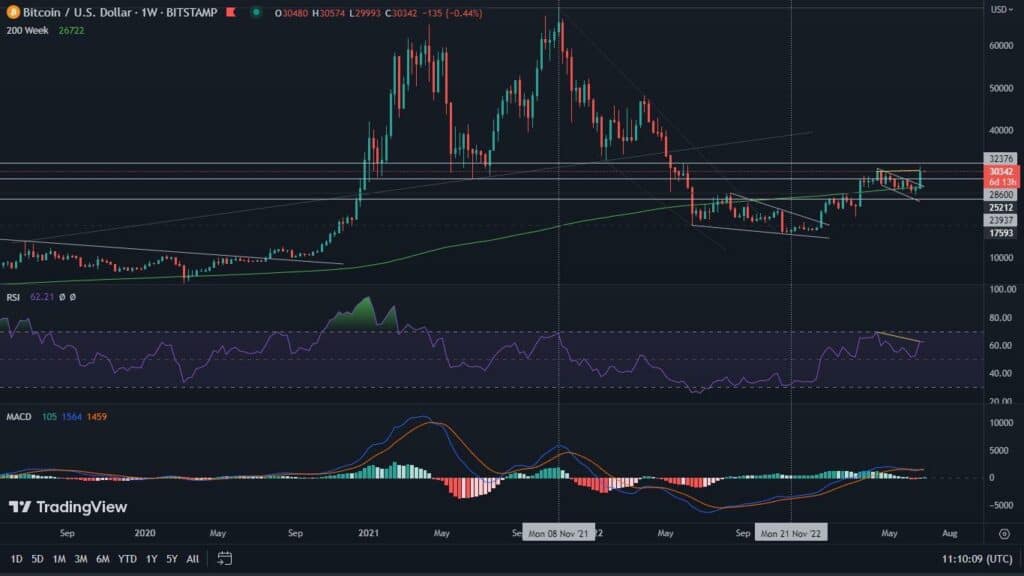
The bulls managed to lead the breakout from the upwards symmetrical triangle, but the bears did not allow them to keep the prices high. Because of this, Bitcoin returned to the consolidation zone, diving below $20,000 again. In anticipation of CPI data, concerns are mounting.
Solid resistance
The fourth week has just begun where Bitcoin is trading below the level of the 200-week moving average. In addition, the Simple Moving Average (SMA) itself has become a strong resistance for it, under which the price cannot get out. After breaking out of the symmetrical triangle, we witnessed a rally of BTC precisely to its area. Unfortunately, the relatively low volumes during the movement indicated that this rally was likely to fail.
The result is a return to the vicinity of the consolidation zone. It is worth noting that similar false breakouts have accompanied Bitcoin more than once. Particularly often, they can be observed during the bull market, which has lasted for several months.
Looking at the chart, we can notice another false signal. The Hash Ribbons indicator, for literally one day, suggested the end of the miners’ capitulation. Admittedly, it did not send a clear buying signal at that time. Nevertheless, the day undoubtedly influenced the start of a short-term rally. As it turns out, Hash Ribbons suffered another breakdown shortly thereafter.
The price action is therefore based on low volumes. The MACD is becoming increasingly bearish, and the narrowing Bollinger Bands suggest an impending dynamic move. Will it start on the day of the inflation data announcement?
The Bitcoin market is waiting for Wednesday’s reading
It appears that the market is anxiously awaiting Wednesday’s release of inflation (CPI) data from the United States. The reading for May was 8.6%. Economists are far from optimistic, and expect quotes for June to be as high as 8.8%.Any deviation from this figure could significantly shake up the quotations of market assets, including Bitcoin. Thus, at the time of their publication, high volatility becomes highly likely.
However, watching the declines before the announcement of the results is entitled to raise another thought. There is a possibility that the market is perversely selling the rumor just now in order to buy the fact and push Bitcoin under the zone of the 200-week moving average again. We remember how important this area is as resistance. Its overcoming could be a catalyst for further increases.
Looking for support, on the other hand, pay attention to this year’s minima, oscillating around $17,600. Breaking this area is the way to the area around $15,000, where there is support from the construction of the downtrend.
RHODL Ratio still above the capitulation zone
When looking for the bottom of Bitcoin’s valuation, it is worth watching many other indicators as well. On a couple of occasions we have cited the situation at least on the charts of The Puell Multiple, Net Unrealized Profit Loss (NUPL) and MVRV Z-Score. Already a few weeks ago, Bitcoin reached the space on them where the final capitulation was historically recorded. It is interesting to note that this area has not yet been captured on the RHODL Ratio indicator.
Thus, looking at its construction, it can be assumed that further declines are still possible.
We also share insights on Bitcoin’s price action on our Twitter account. If you are not already following us, we encourage you to do so. You’ll find the link at the top of the screen.

