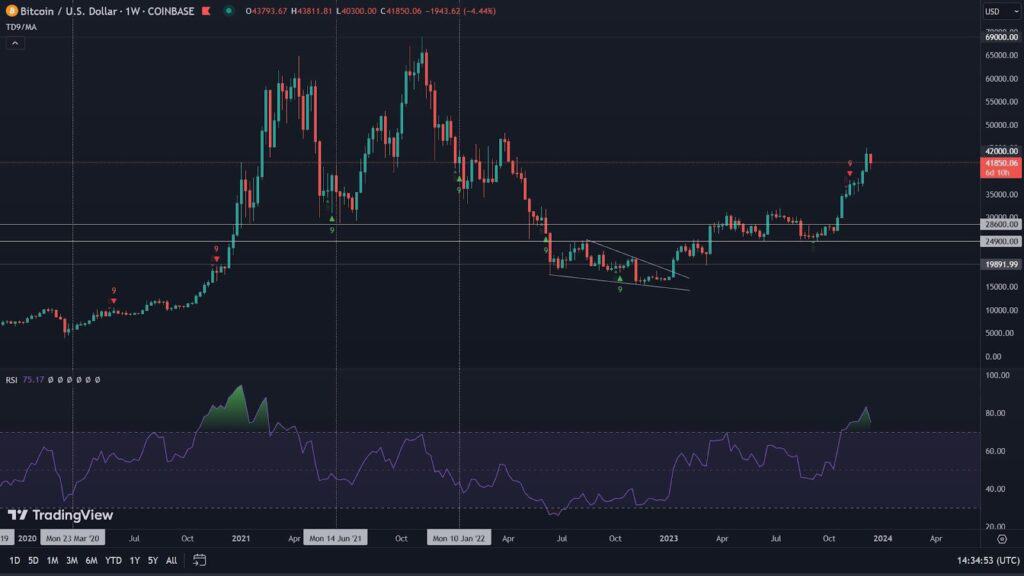
After 189 days, and a very bumpy road, Bitcoin reaches its new all-time high! Let’s take a look at what’s happening on the charts.
ETFs help though
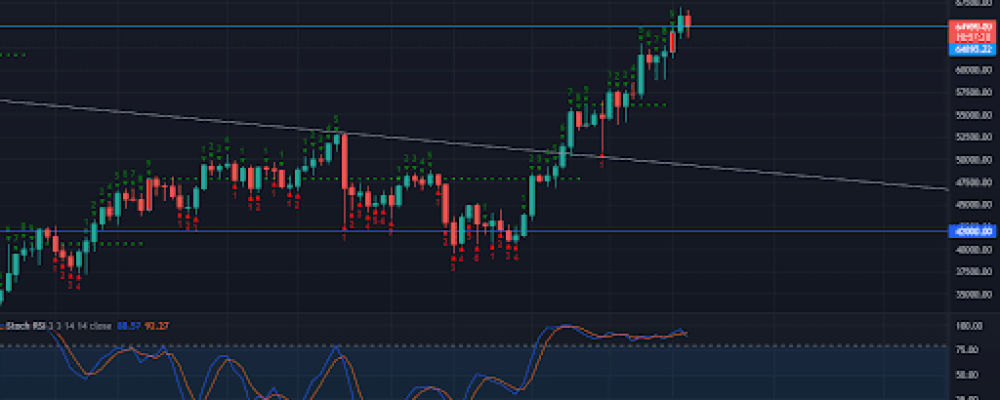
In recent days, we’ve been experiencing real market uncertainty surrounding the launch of the first U.S. ETF on Bitcoin. Meanwhile, this one even proved to be a catalyst that pushed the price of the largest cryptocurrency to a new ATH of $67,016.50.
Bitcoin being in the vicinity of its record is a sign that practically all traders are currently taking profit. There is therefore a fairly high probability of profit taking. The dynamics of the price movement is also rapid, which should suggest us to be cautious. Let’s see if the indicators on the chart confirm this.
As we can see, the TD Sequential was already indicating local overvaluation on the day Bitcoin hit $67,000. It therefore suggests a possible trend reversal. However, this does not necessarily take place at exactly the same moment. Also bearish is the Stochastic RSI, which has been trading at very high values for quite some time, indicating the need for a rebound. It is worth remembering, however, that Bitcoin’s corrections after establishing each ATH, usually oscillated around the price’s retreat to levels previously defined as record highs. In this case, we are talking about the defense of less than USD 65,000. Thus, a continuation of the breakout and a final touch of the trend line created from the combination of the 2017 peak with the April 2021 peak (yellow line) is possible. This is a level that today is located near $72,000 and is steadily rising. A stronger selling reaction in this area is highly likely. However, should the market fail to behave as it has generally done on any previous declines, we can expect strong demand below the $60,000 levels, which have already been a zone of significant exchange.
Ethereum situation
The second strongest cryptocurrency is following in Bitcoin’s footsteps, and as I write this article it has almost equaled its ATH of May 12, 2021. We are seeing a breakout above the downtrend line, and effective confirmation of it as support (white line). This is a very bullish sign. This move is a consequence of the RSI divergence that we mentioned in the previous analysis. Meanwhile, we also temporarily see a bearish RSI, which could indicate a short-term correction. Nevertheless, the medium-term target from our previous analysis of around $5,500 still remains in play. A possible change in trend should result in a more serious demand recession around $3,400 – $3,700.
Altcoins have moved
In the previous analysis, we drew a downtrend line suggesting that near the 47.5% dominance of BTC, altcoins should catch their short-term opportunity. This has happened, making us see increasing demand for them. The question is whether this one will hold. A new ATH on Bitcoin has typically resulted in greater investor confidence towards smaller coins, suggesting a return of BTC to 40% dominance. On the other hand, however, this resistance may only be temporary, and a breakout has the power to push Bitcoin to the 50% market capitalization level.
Speaking of capitalization…
Here we also note a new all-time record. The total value of the cryptocurrency market, at the time of writing this analysis, is reaching its peak at $2.736 trillion. Based on the dynamic inflow of cash into the market, we can come up with various scenarios of potential resistance and support. However, in this case, much more will depend on the movement of the Bitcoin price itself, and it is this movement that we recommend watching.

