The situation that many feared is just happening. Bitcoin miners are officially capitulating due to the high Hash Rate and skyrocketing electricity costs. What could this mean for the price of BTC and the health of the entire cryptocurrency market?
Bitcoin on the weekly interval
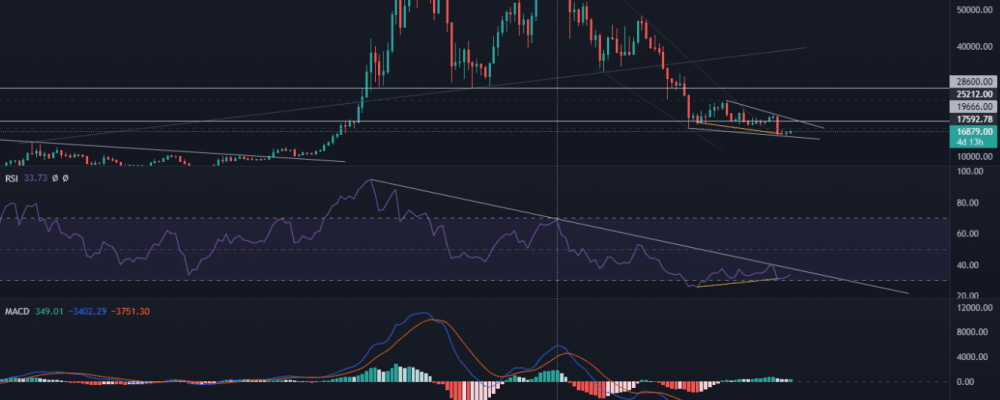
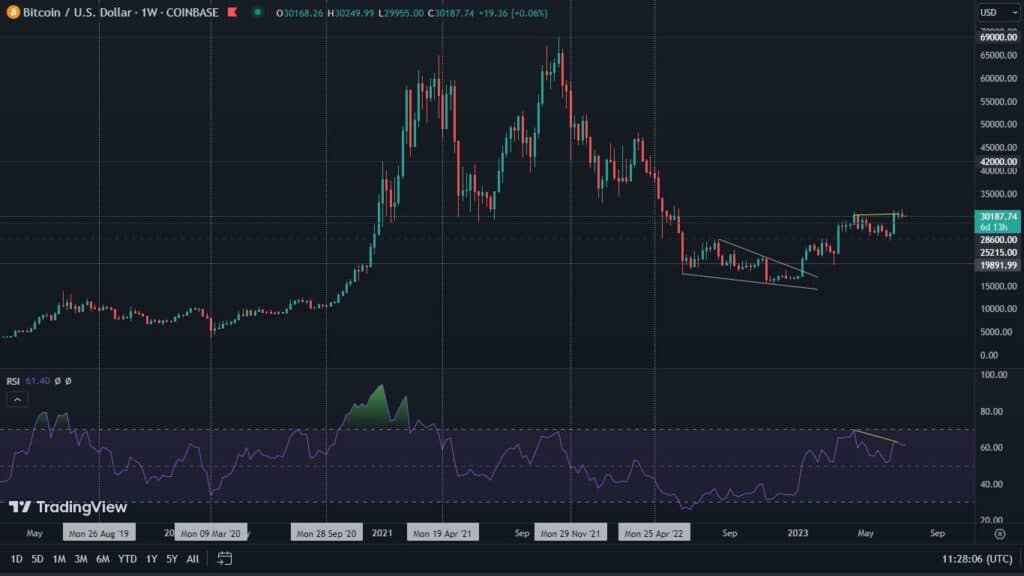
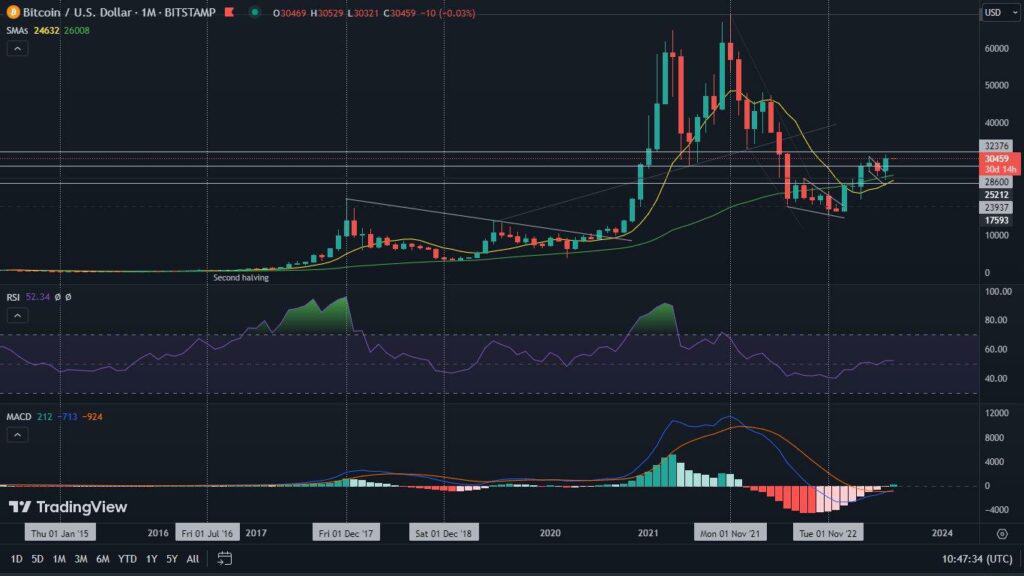
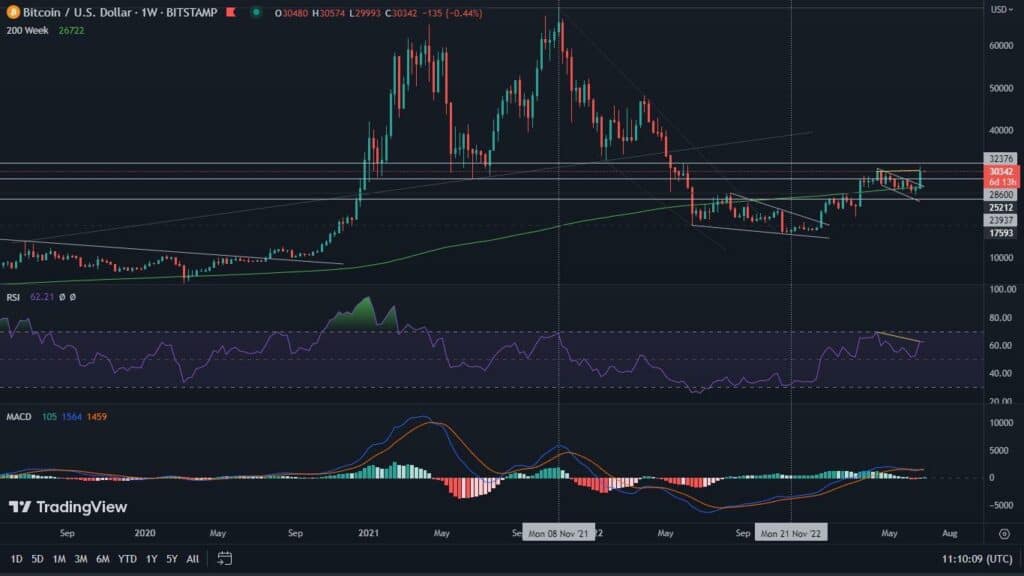
But before we discuss the details of the miners’ condition, let’s look at the situation on the weekly chart. Here we see an ongoing rebound. It is small, as the increase in the value of BTC was only 1.03%. At the same time, we observe very bullish signals that are still in play. This is primarily a bullish RSI divergence, as well as a bullish pennant formation that is still respected. Interestingly, Bitcoin is constantly struggling against RSI resistance. At the same time, the bearish MACD momentum is clearly weakening and tipping the balance towards the upside.
Thus, the structure of the weekly interval looks very positive. Let’s see if it will be confirmed on a slightly smaller scale.
Bitcoin on the daily chart
It turns out that the promising structure of the above analysis is also justified on the daily chart. A number of bullish divergences, both long-term and short-term, persist on it. The longest accompanies the RSI indicator. Shorter ones are also visible on the OBV. In addition, they are constantly moving from regular to hidden variances. Such divergences clearly indicate a potential upward breakout of the Bitcoin price.
An additional factor worth paying attention to are the Bollinger Bands. First of all, we observe their narrowing. After three days, when Bitcoin tested the 20-day moving average, located inside them, a breakout occurred. At the time of writing this analysis, the price has reached the upper limit of the area. Keeping it above the 20-day SMA may give further grounds to believe that Bitcoin is entering an uptrend. We will soon see if it has a chance to stay with us for a while longer. For the time being, another divergence has formed with this movement, this time bearish, which we have marked in pink on both the price chart and the indicator. It may slow down the current breakout.
Bitcoin miners with serious problems
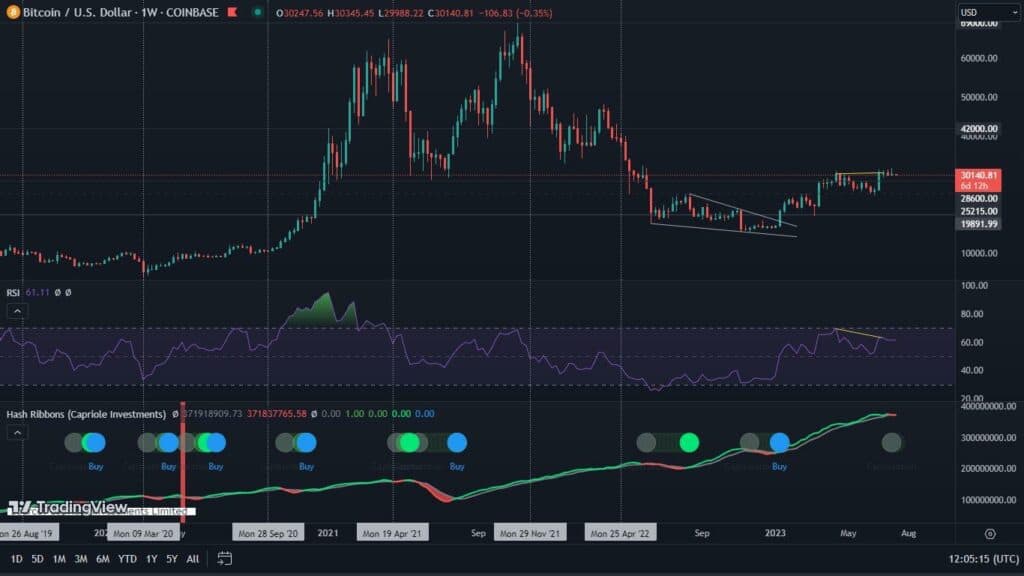
However, by far the most important of all the indicators present on the charts, is the Hash Ribbons at the moment. It is responsible for the situation of the miners, which are in a capitulation phase at the moment. So far, there have already been thirteen similar situations. Three times we have seen rallies after them. Five times there have been sideways movements, and for another five times declines.
However, it is worth noting that during the ongoing bear markets, after the capitulation of the miners, rallies never occurred. On the other hand, four times there were further declines, and only once a sideways movement.
Given these statistics, we can assume that the probability that Bitcoin has already reached its price bottom is only 20%. Fortunately, a number of indicators (such as those cited earlier) are emerging that suggest an imminent upward movement.
The first Hash Ribbons buying signal that failed
What is interesting, however, is that in August we observed the thirteenth Hash Ribbons buying signal in Bitcoin’s history. As it turns out, it is the first one to fail. We reported on the high probability that it would not play out positively in our analyses at the time. As a result, after exactly 100 days, there was another capitulation. Meanwhile, the price of Bitcoin, from the time of the buying signal to the new bottom, fell by nearly 25.5%.

