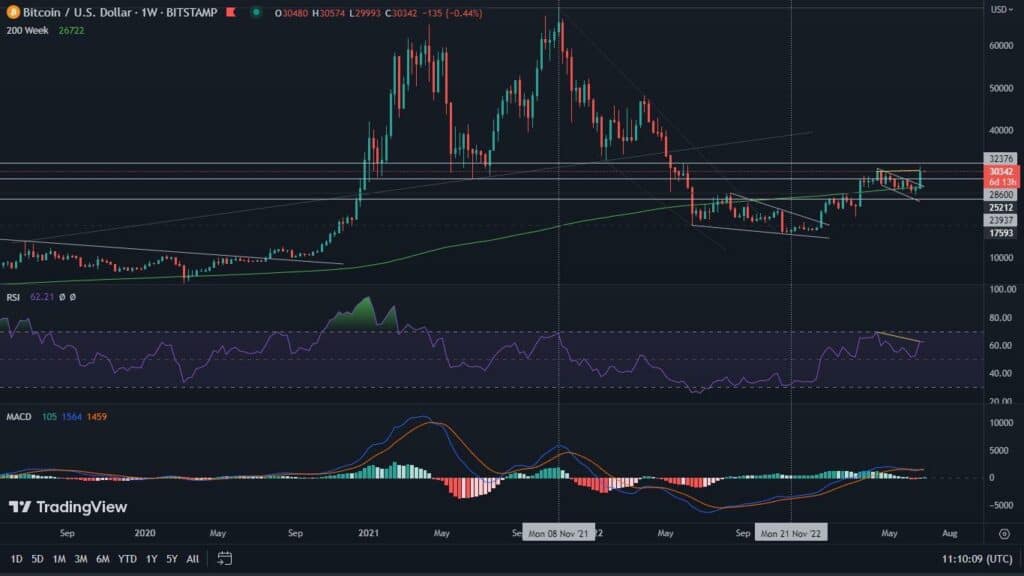
Bitcoin broke a very important line of resistance, but as we predicted, this did not change its situation. Meanwhile, factors are emerging that suggest that higher volatility may be coming in the coming days.
Downward trend line defeated – what’s next for the Bitcoin price?
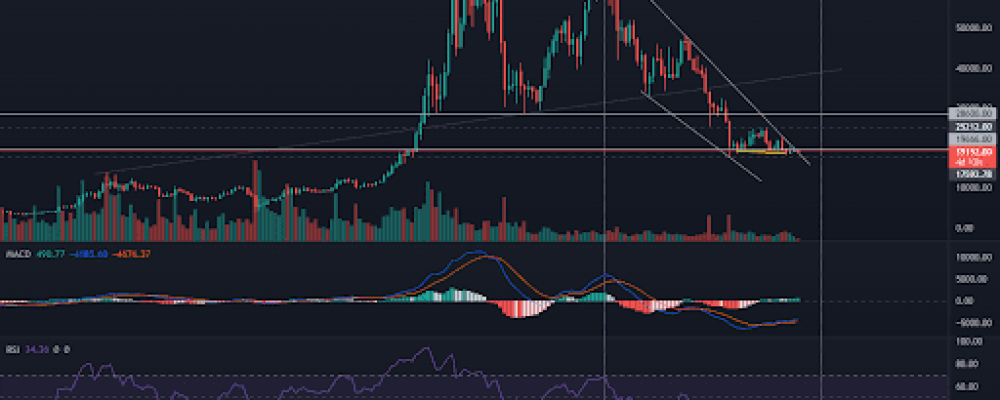
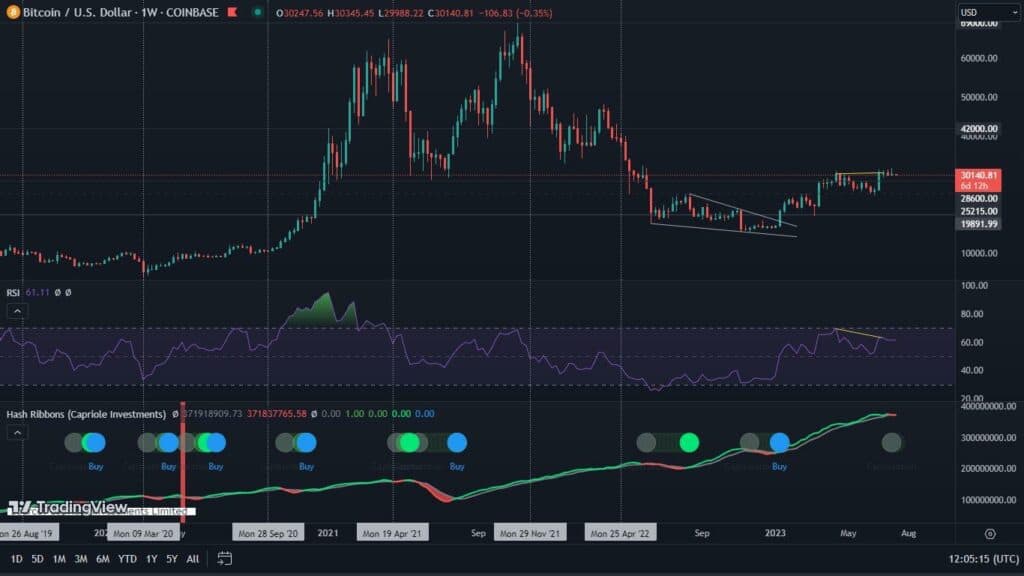
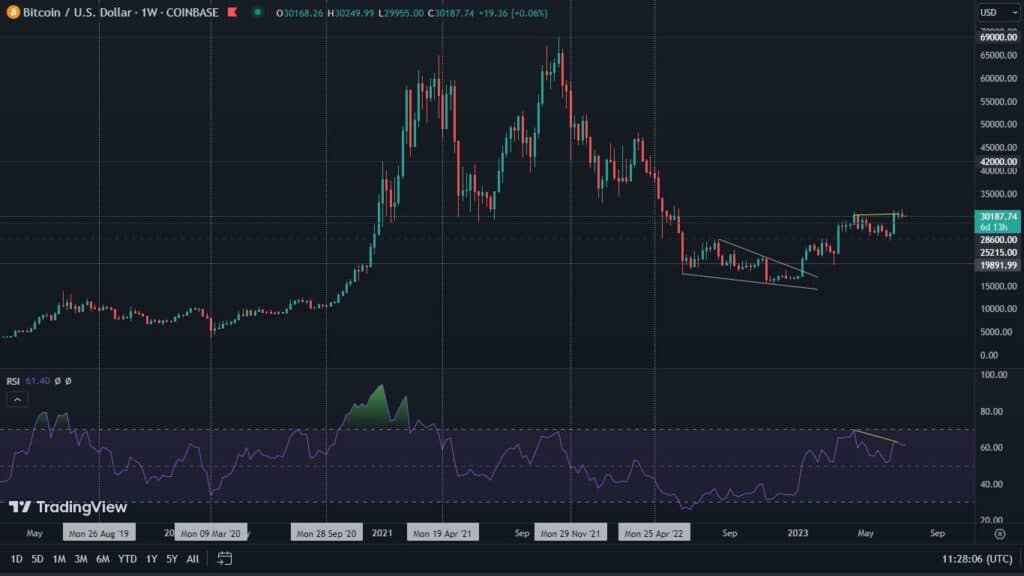
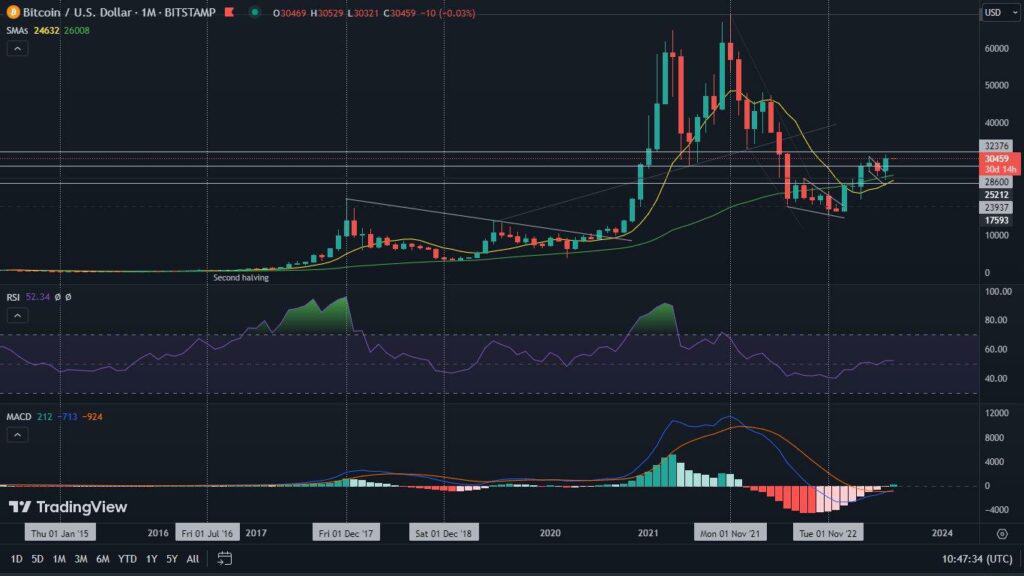
We begin our analysis, of course, by presenting Bitcoin’s price situation, on the weekly chart. Here we see that after last week’s struggle, as we predicted, Bitcoin has overcome the long-term downward trend line. Unfortunately, as we also expected, this was done through a sideways movement, which did not show particularly high volume in the process. It can therefore be assumed that this breakout is false, or, at best, represents an impulse for a continuation of the horizontal movement. In the meantime, we can see that the MACD is trying to uninterruptedly sustain a bullish pattern, and the RSI continues to show a bullish divergence. After two weeks of gentle increases (about 3.5% in total), it may be invalidating. Nevertheless, it should still be watched.
At the same time, it is worth noting that the past week’s close was the fourth in a row made below the 2017 peak. Despite this, the price remains at a relatively close level, indicating that both distribution and accumulation are going on here with balanced strength. The question is when this will change…
Bitcoin on the daily interval
The daily chart, on the other hand, provides us with even more interesting information. On it we see that Bitcoin is still trying to defend the downward trend line, which it overcame last week. Undoubtedly bullish on this situation, investors see a potential double bottom on this occasion (indicated by yellow curves on the chart). Paying attention only to these aspects, we can assume that there is an opportunity for a rebound.
Volatility is also foreshadowed by the narrowing structure of the Bollinger Bands. Meanwhile, the MACD is showing a bearish crossover, which is absolutely not encouraging. One has to agree that this intersection lacks momentum, but it is still a pro-fall signal. At the same time, it is worth remembering that the double bottom here has the right to be an apparent formation.
Macroeconomics up again
Another important factor suggesting price fluctuations, is the upcoming US CPI reading on Thursday, October 13. In the chart below, it is clear that the days of the data reading, have often favored the impetus for BTC price movement. Now that technical factors are also in favor, this probability is growing significantly. Meanwhile, economists are predicting a CPI value of 8.4%, a figure higher than last month’s data indicate.
Fundamentals win out over technical data
We are constantly looking at the S&P500 index. Recently on its chart, a clear bullish divergence has been drawn. The beginning of the past week effectively played it out. However, on Friday, data on the level of unemployment in the United States emerged. They turned out to be much better than expected, which resulted in… declines. This is a situation in which “good news is bad news”. The lack of an increase in unemployment gives the green light to further interest rate increases and thus continue the fight against rising inflation. This is also an example of how fundamental factors are able to overcome technical parameters. We know that at some point this can have a strong impact on Bitcoin as well.

