As we announced last week, volatility has emerged on Bitcoin’s chart. Last Thursday initiated a move that, within 24 hours, drove the price up nearly 9.6%. Shortly after, BTC re-entered a consolidation, but there are many indications that it will not last long.
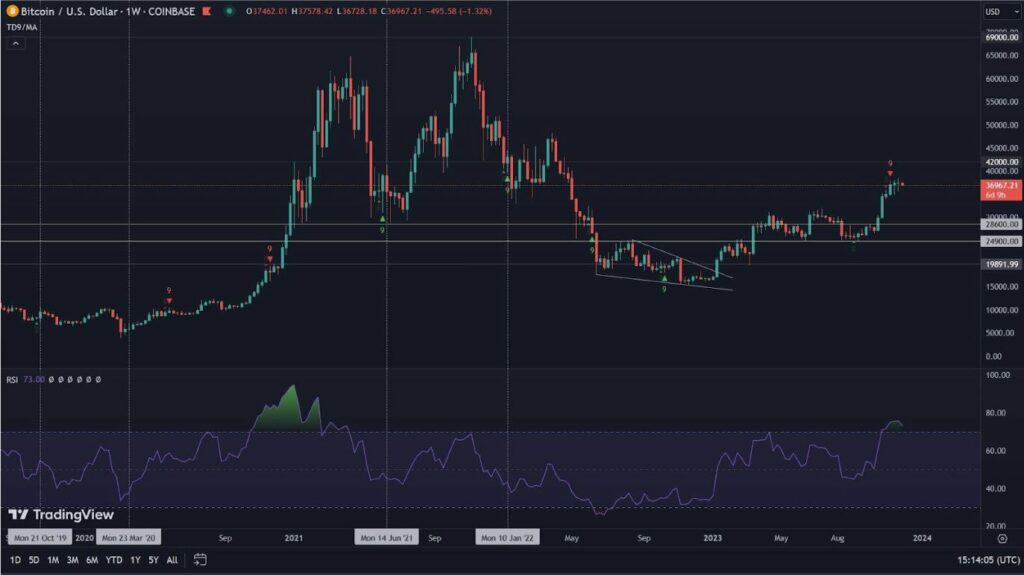
Bitcoin on a weekly basis
Again, the zoomed-out perspective helps us not lose sight of aspects at lower intervals. It thus presents us with some interesting information. First of all, the past week resulted in the successful defense of the long-term downward trend line. The MACD indicator is still unchanged, thus maintaining a bullish momentum. It lacks momentum of course. However, the clearly positive MACD itself is still a good sign. Noteworthy is the presence of 9 red candles of the TD Sequential indicator. It usually suggests the vicinity of the turning point, for the movement in force.
Thus, the above indicators say that the probability of Bitcoin price increases is emerging.

In addition, it is worth noting that last week represented the fifth consecutive closing of the price below the 2017 peak. Counting from June this occurred for the seventh time. On the other hand, looking at the RSI, we will note that it has already passed the 92nd week that Bitcoin is below the index’s downward trend line.
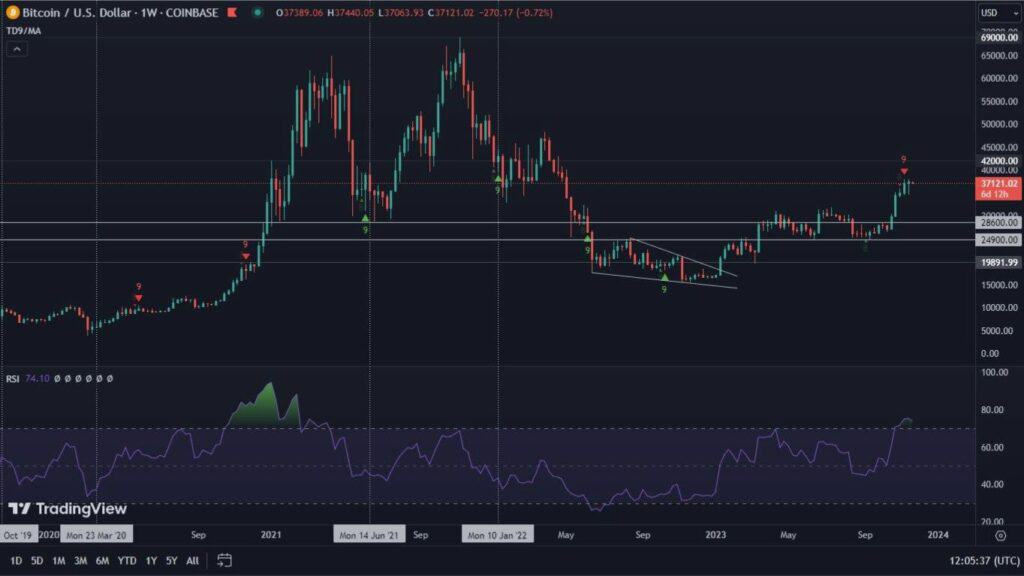
Bitcoin on the daily chart
On the other hand, on the daily chart we once again note the long-term downtrend line, which was broken out and not accompanied by positive volume. This caused a change in the structure of the chart. Nevertheless the previous trend line was replaced by a new one (marked with dotted lines) which is clearly respected so far. It is supported at the bottom by a support line (also dotted) which in combination form a descending triangle. As we know, this is clearly a bearish formation. Accumulation inside the triangle is confirmed by the volume, which is steadily decreasing. However, the clear, yet strong purchases of BTC at low price levels inside the formation suggest that the decline will not happen. As with the previous long-term formation, a sideways price exit, or even an upward breakout, seems highly likely. In the meantime, the indicators do not indicate any anomalies.

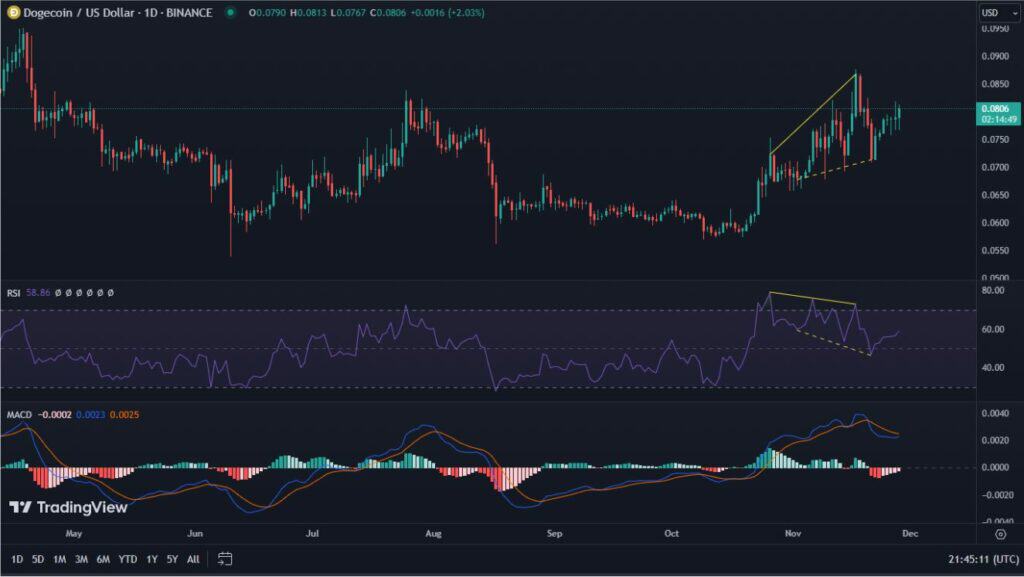
The dollar on the bearish side
The data on the weekly chart thus seems to favor the bulls. The formation on the daily chart, on the other hand, points to the bears, but leaves some doubts about its validity. We can be helped by the dollar index, which as we know, is inversely correlated with the price of Bitcoin.
Here, however, good news is hard to come by, the DXY is holding the uptrend line, from the vicinity of which it has just managed to bounce. MACD is clearly changing momentum to bullish. Meanwhile, the RSI defends the 50 level, which is a very important support in the context of further increases.

We can see that the DXY is clearly siding with the bears. This has been the situation since February. Since then, until June, Bitcoin was clearly falling. However, in the following months, despite the DXY’s increases, we witnessed consolidation on the BTC chart. It is possible that despite signs suggesting volatility, it is the sideways movement that is more likely to continue.