In one of the recently published materials, we highlighted the opinions of market analysts regarding the further movement of the Bitcoin price. They are almost unanimous – BTC may be waiting for a longer consolidation. So let’s take a look at the indicators and see if they confirm this hypothesis.
Bitcoin on the weekly chart
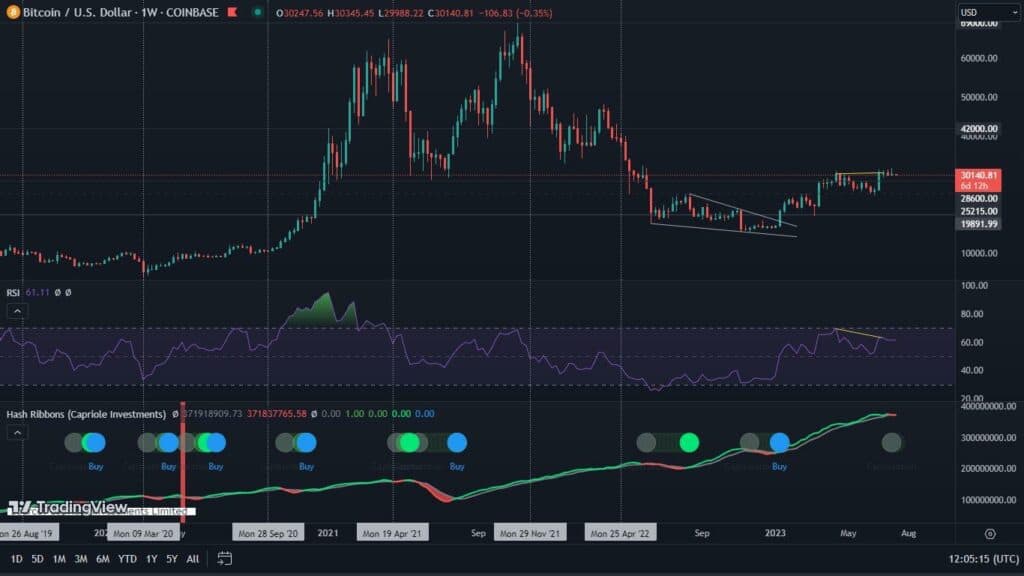
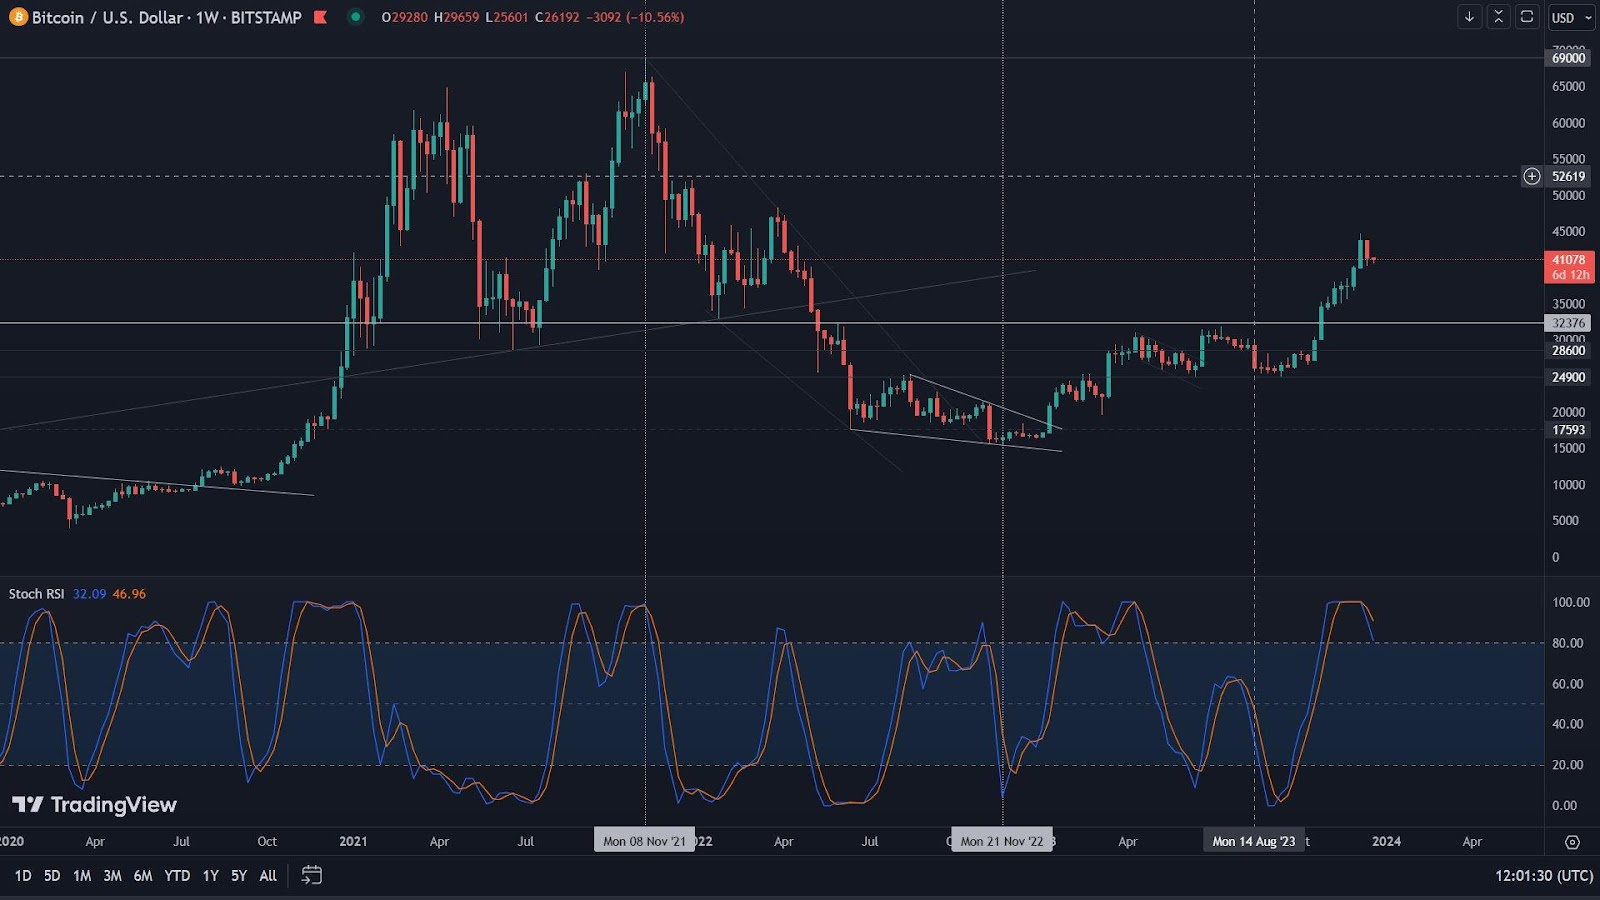
The past week brought a long-unseen correction on Bitcoin’s chart. The leading cryptocurrency lost nearly 5.6% in value. Thus, this was the first red candle, after as many as eight weeks of uninterrupted increases. However, this did not help reset the TD Sequential indicator, which drew 14 consecutive ascending candles.
Despite this, the RSI value maintains a very healthy level, settling around 73.

It looks like the long-awaited bearish cross on the Stochastic RSI indicator is finally coming to fruition. Thus, looking towards potential support levels, it is worth noting the value of $40,000. Another area that, in the event of a breakdown of the chart structure, we can watch is $32,300. However, there is still a long way to go before it is possibly reached.
Bitcoin on a daily chart
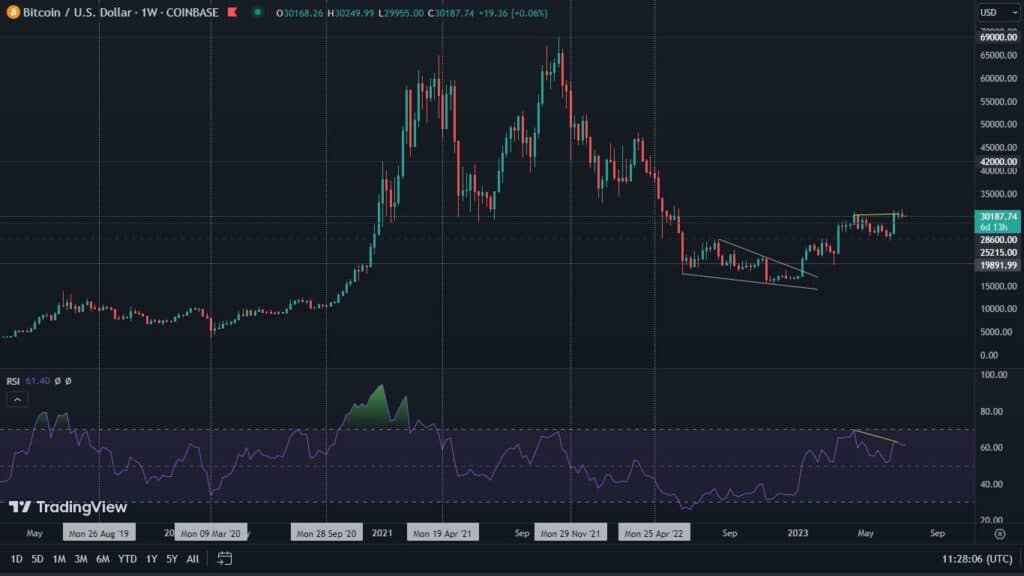
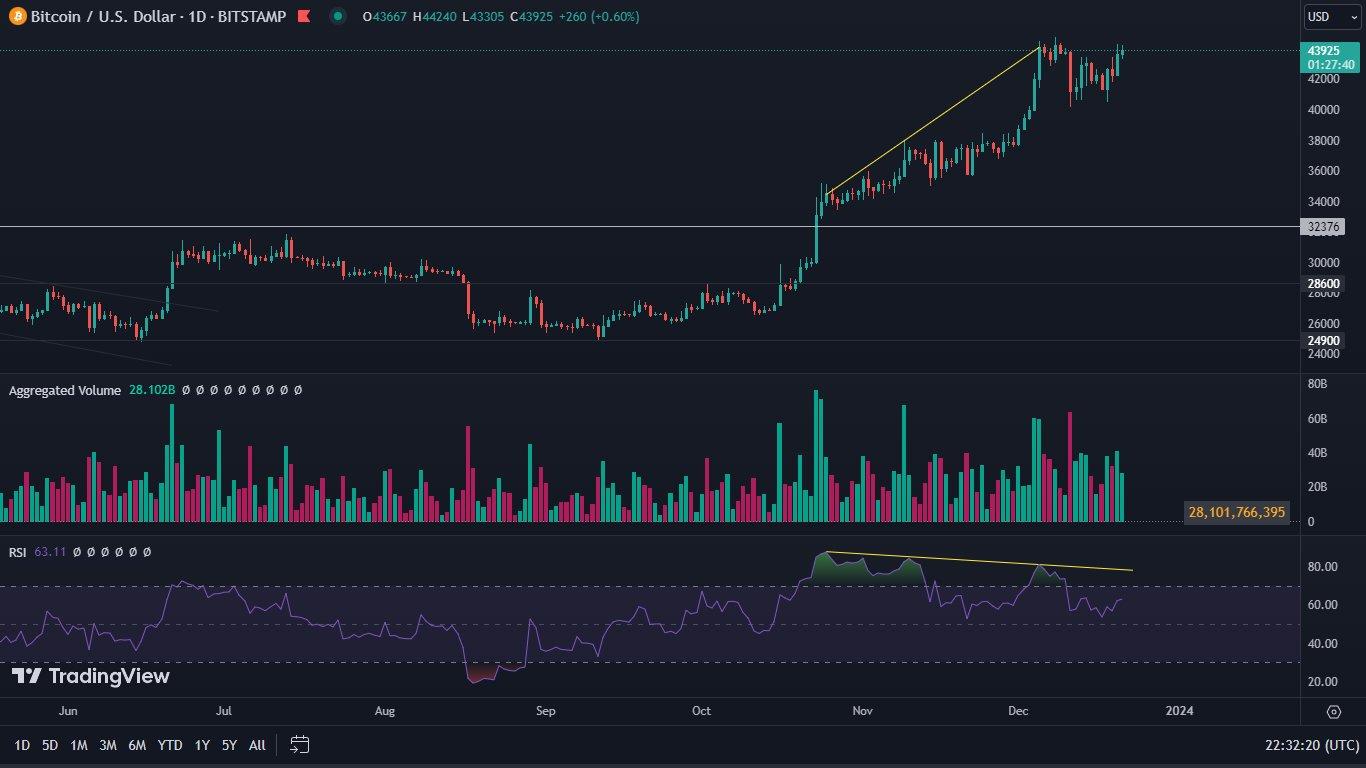
The one-day chart of Bitcoin sends a number of diverse signals. However, they merge into one rather interesting picture. Well, as it turns out, the leading cryptocurrency may just be getting ready for yet another upward bounce.
Looking at the indicators, we see many red flags. One of them is the volume, which is successively decreasing. Another is the RSI, which is showing a clear bearish divergence. However, we marked it with an extended yellow line for a reason. This is because we expect BTC to make one more upward breakout, which will close the picture of the observed disparity.
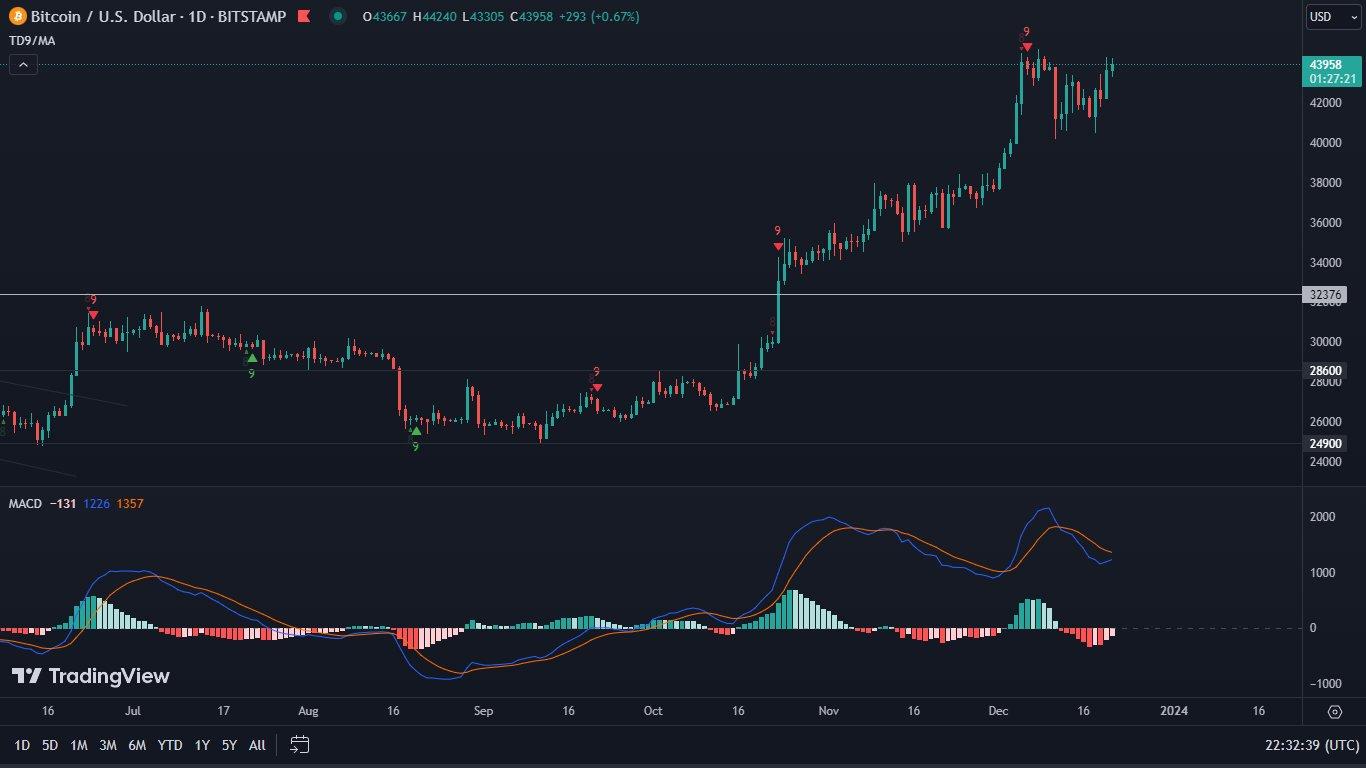
Continuing the observations, it is worth noting TD Sequential, which, after an upward revaluation, made a complete reset. However, this did not negatively affect the chart, which maintained a bullish structure. What’s more, the MACD is currently aiming for a bullish cross, which has the right to influence further increases in the cryptocurrency.
Altcoins in the starting blocks
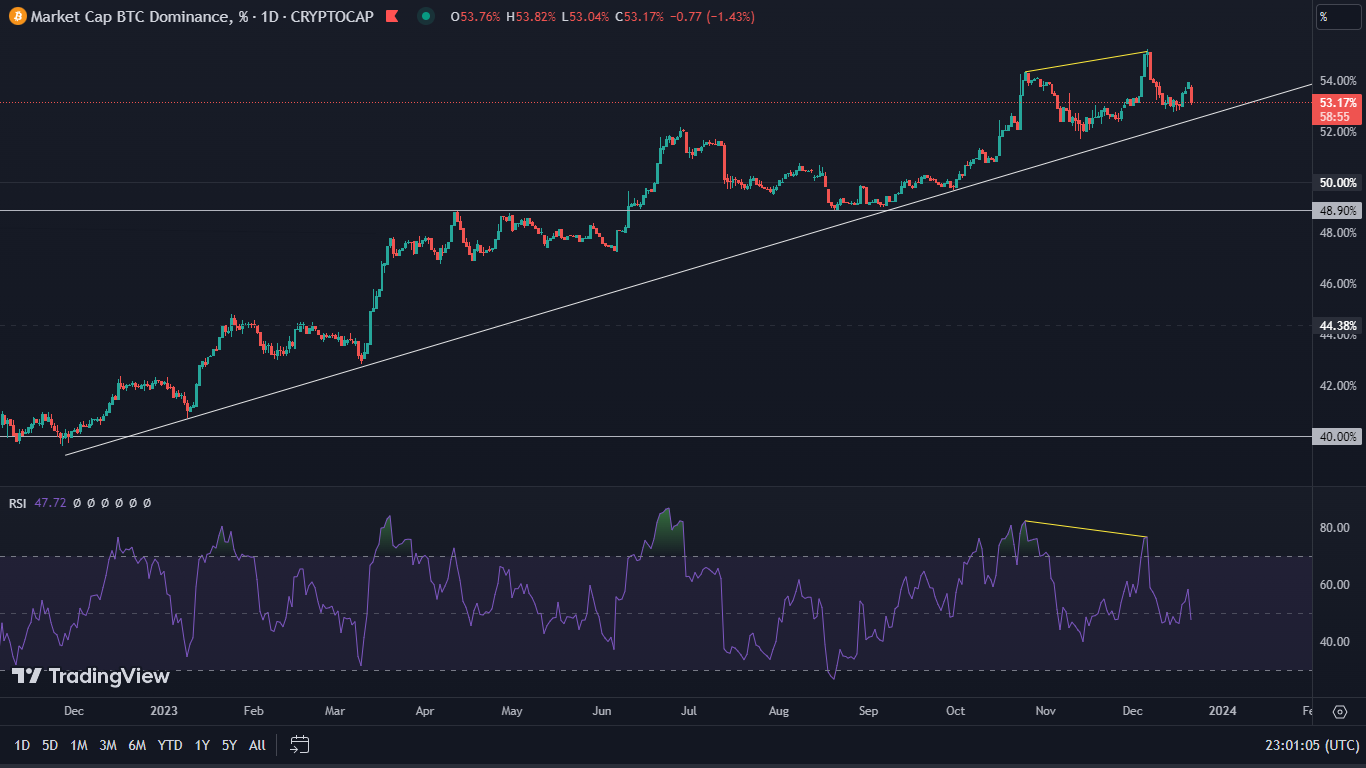
We continue to look at the dominance of Bitcoin. This one has been holding steadily above the trendline so far, trading near 53%. The bearish RSI divergence, which we recently marked on the chart, has been steadily in play, pushing Bitcoin’s advantage over altcoins into the close vicinity of the aforementioned line. Expectations of breaking it are high. If this situation is successful, the start of the long-awaited altcoin season becomes highly probable.
Crypto bull time
Leading market analysts mostly predict that Bitcoin will face an extended period of consolidation at levels between $40,000 and $45,000. In our opinion, however, there will be an attempt to attack $48,000. This kind of scenario is justified by the indicators. Nevertheless, subsequent declines, which should brake above the first of the aforementioned values, become highly probable.
The altcoins, which already illustrate a high readiness for the start of increases, may also gain from such a scenario. We suppose that these may occur very soon.