While bitcoin is oscillating around $30,000, the altcoin market is eagerly awaiting the next significant move. Let’s take a look at the situation on the chart of the leading cryptocurrency and the reactions that accompany smaller coins.
Stagnation continues
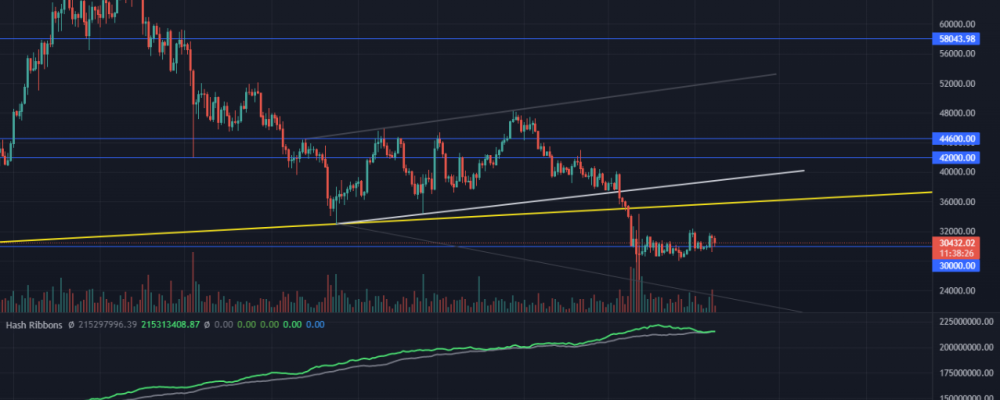
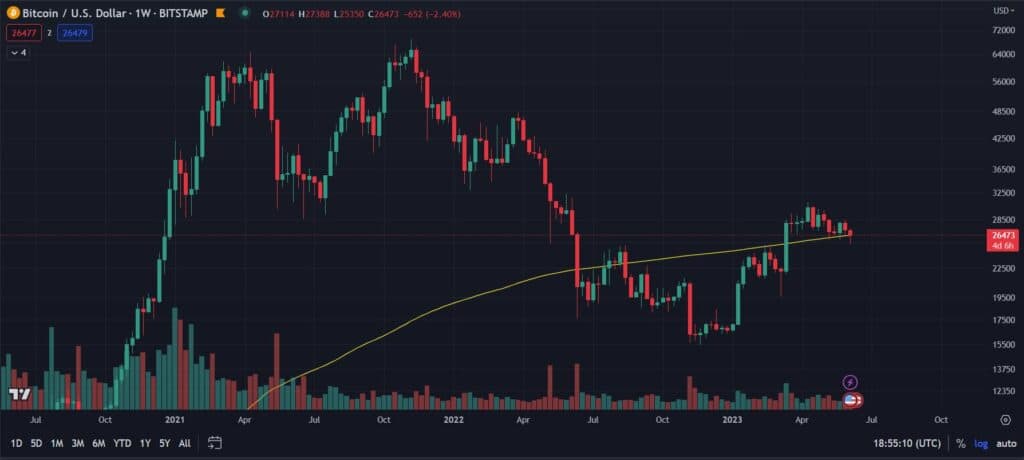
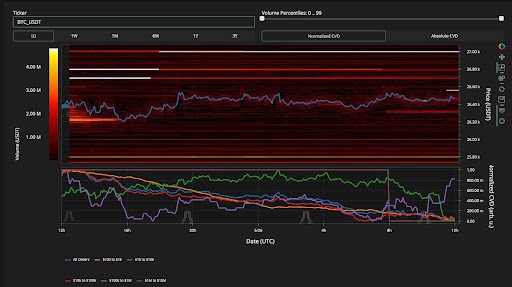
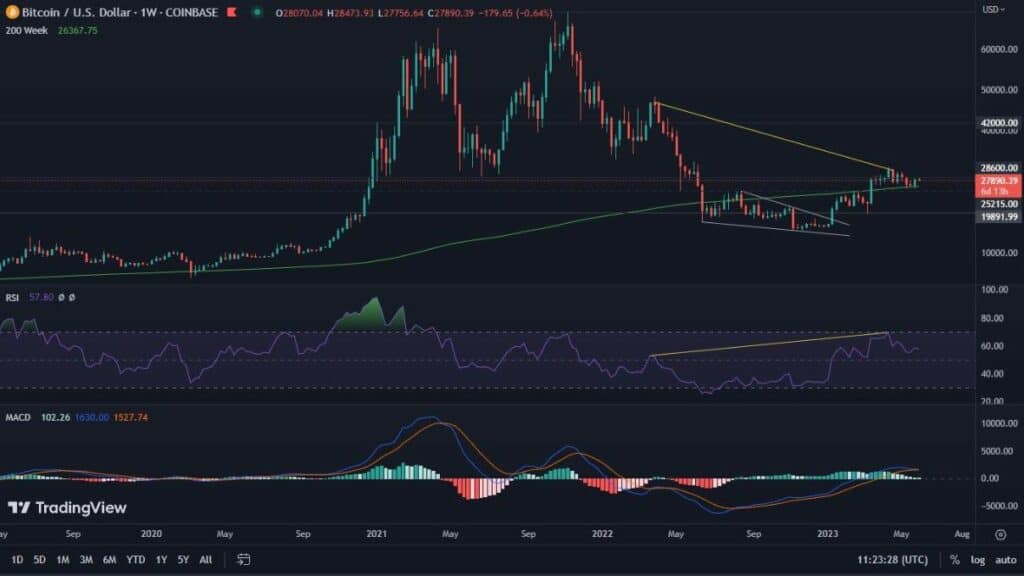
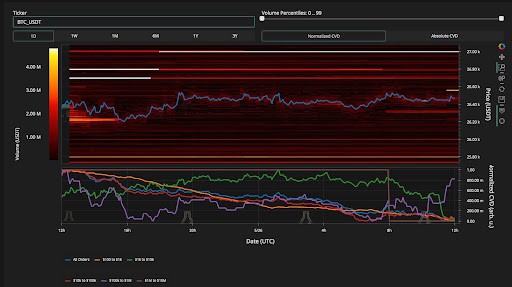
Since May 10, when Bitcoin first touched the $30,000 level, there is hardly a day when it does not cross this border from below or above. Thus, we can see that the price of the leading cryptocurrency is stabilizing. However, given the volumes, this area does not seem to be a sure support.
Nevertheless, a short-term rally still seems likely. Quite clear resistance for it may turn out to be the already former support line of the long-term trend (yellow color), or the lower border of the ascending channel that accompanied BTC until the beginning of May.
Another interesting fact is the behavior of the Hash Ribbons indicator, which for the first time in a very long time suggests that the costs of mining Bitcoin are exactly equal to its market valuation. This fact may lead to the capitulation of miners. Looking historically, we do not observe a rule as to the behavior of the price in similar periods, but it is undoubtedly a worrying signal.
Dominance of BTC
Moving on to altcoins, it is essential to pay attention to the dominance of Bitcoin. As we know, altcoins come to the fore mainly when the leading cryptocurrency reaches key levels. Meanwhile, BTC is located in between them. From the top, we see a frequent reaction area of 50%, and from the bottom, we see the boundary of the descending triangle from which the breakout occurred and which has not yet been tested as support. This means that there is a high probability for BTC to rebound from the former and thus strengthen the alt. However, the downward movement could happen much earlier, which could lead to an unexpected reaction of smaller coins and a test of the breakout level in the first place.
Ethereum plays out the divergence
In the previous analysis we highlighted Ethereum, which indicated a very clear bearish RSI divergence. This resulted in declines , which once again pushes ETH to the $1700 level. Volumes are weakening and so is the MACD. This situation may suggest declines even to the level of USD 1420. A possible breakout will result in an attack on USD 2000.
Solana highly volatile
Among the top coins, Solana shows particularly high volatility. Moreover, over the last few days, we can notice numerous RSI divergences on its chart, both bullish and bearish, which successively contradict each other. Volumes seem to be higher than on the other major coins, but still do not inspire great optimism. On the other hand, a descending cone is clearly visible, which may suggest ranges of SOL price movement. In the case of significant declines in Bitcoin, a Solana drop to $20 seems quite likely. On the other hand, in the case of increases, we can expect to reach even $70.
Avalanche with a very clear structure of resistance and support
Apart from the fact that Avalanche at the moment of writing this text is located in a very historically significant support area, its further potential movement ranges are clearly visible. From the top we see resistance at $40, while from the bottom we see strong further support at $10. MACD seems to be weakening, which has the right to drive further selling pressure, but this, as with other coins, will depend primarily on Bitcoin.

