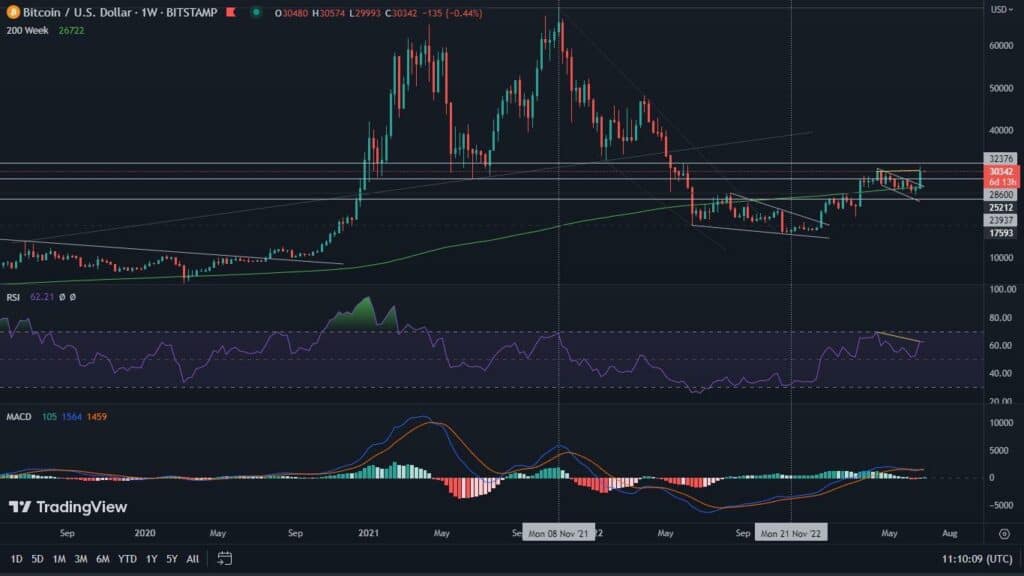
In recent materials, we have been paying close attention to traditional markets when analyzing Bitcoin’s price action. Meanwhile, the S&P500 index is falling, while the leading cryptocurrency maintains fairly stable price levels. So is there nothing to worry about, or is the worst yet to come?
Bitcoin on a weekly basis
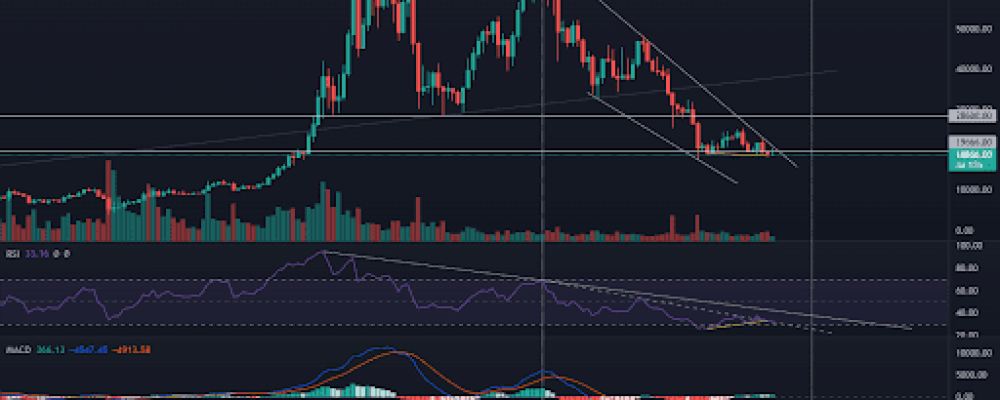
Over the past week, bitcoin lost nearly 3.1% in value. This is a relatively small movement. However, what the chart presents may cause concern. Well, for the fourth time since June, and the second in a row, BTC closed the week below its 2017 peak. Moreover, the frequency of the price’s descent below $20,000 suggests that the support zone has become a distribution zone. This type of price action is a clear indication of potential further downward movement. Thus, volumes remain low. Interestingly, however, the RSI indicator manifests the first slight bullish divergence. Moreover, it is defending an important support level, marked by the dashed line. The MACD also maintains bullish momentum, albeit not impressive.
The signals seem to be quite contradictory. So let’s look from a slightly different perspective.
Bitcoin price on a daily basis
On the daily chart, we see that Bitcoin once again tried to reach the level of the long-term downtrend line. This operation ended in failure. Of particular note is the candle formed on Tuesday, September 28. On that day, BTC rose nearly 6% from the start of the session to close the day at -0.8%. The price candle formed at this point indicates a continuation of the downward movement. Meanwhile, the MACD is attempting a bullish crossover, suggesting possible increases. However, the indicator’s movement dynamics remains far from expectations.
SPX with a new low this year
After looking at both charts, we can clearly see that Bitcoin is creating market uncertainty. An analysis of the SPX situation, however, sheds a little more light and hints at some of this.
And here, on the weekly interval, a second consecutive very strong downtrend candle appears. We reported on the possibility of its formation in the previous material. If another one appears, a formation of three black crows will be formed. It is a strong signal of the continuation of the downward movement. And this one, at the time of writing this analysis, is deepening overnight, thus forming a new this year’s minimum. The MACD has experienced a bearish cross in recent days, which also drives downward power. It is interesting to note, on the other hand, that the RSI at this time is showing a bullish divergence, which, depending on the week’s close, has the power to initiate a gentle retracement.
So what is driving the Bitcoin market?
Traditional markets are in such an uncomfortable position that it is hard to imagine that Bitcoin will be able to keep their pressure on. However, let’s turn our attention to what is happening on the exchanges. Looking at Bitcoin reserves on SPOT trading platforms, we see that these are constantly falling. At the time of writing this analysis, they are slightly above the one million level.
Meanwhile, derivatives platforms are experiencing high inflows. This may indicate that there is an opportunity for significant movement ahead for Bitcoin. In the meantime, most indications are that this movement will take place towards the bottom.

