Despite the dramatic state of the global economy, high interest rates, as well as the deteriorating condition of many banks, Bitcoin is doing well and recording another this year’s peak. Let’s see what the chances are for the king of cryptocurrencies to continue climbing.
Bitcoin on the weekly chart
USD 28,567 is the new peak that Bitcoin has reached in 2023. This is an increase of 73% in just 78 days. It is difficult to find any traditional market asset that has achieved a similar result. Undoubtedly, such results are influenced by the banking crisis, which prompts customers of these financial institutions to store their assets in a safe place. Such a solution becomes Bitcoin, which, sent from the exchange to a cold wallet, is under our exclusive control.
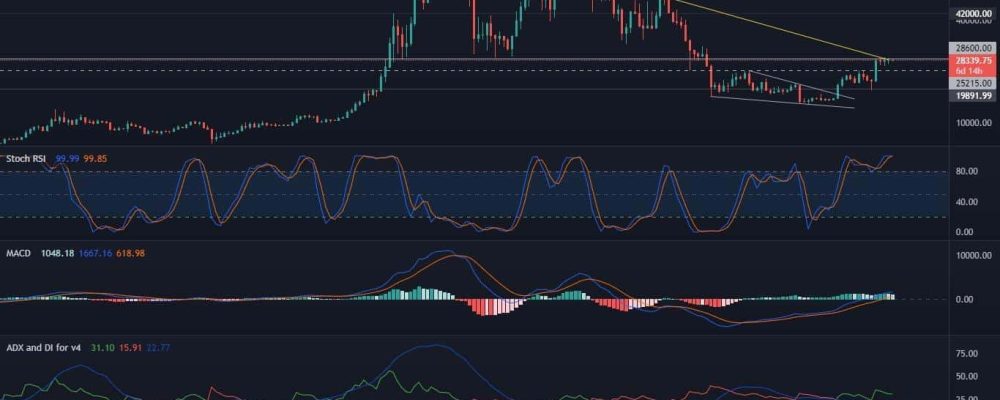
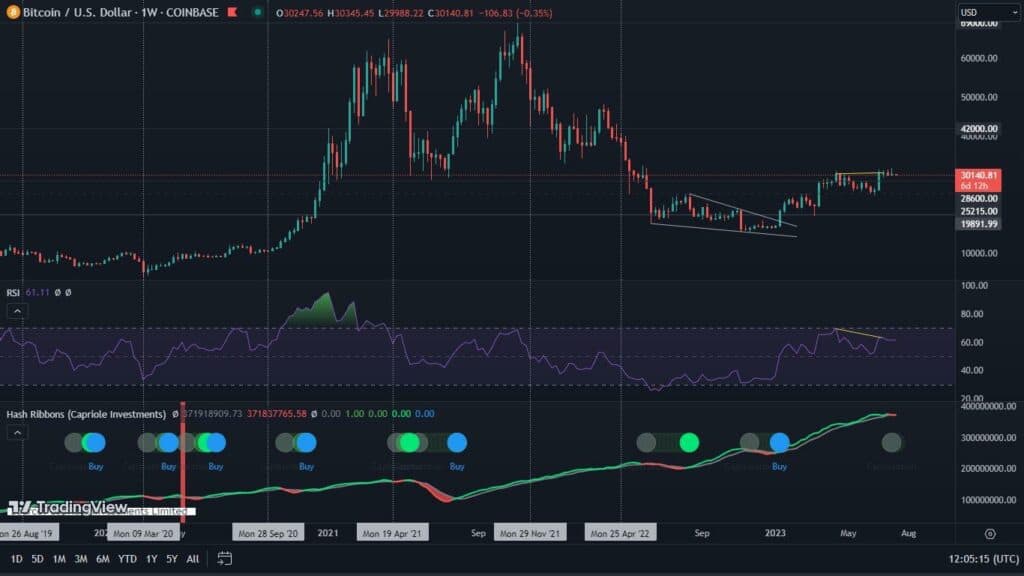
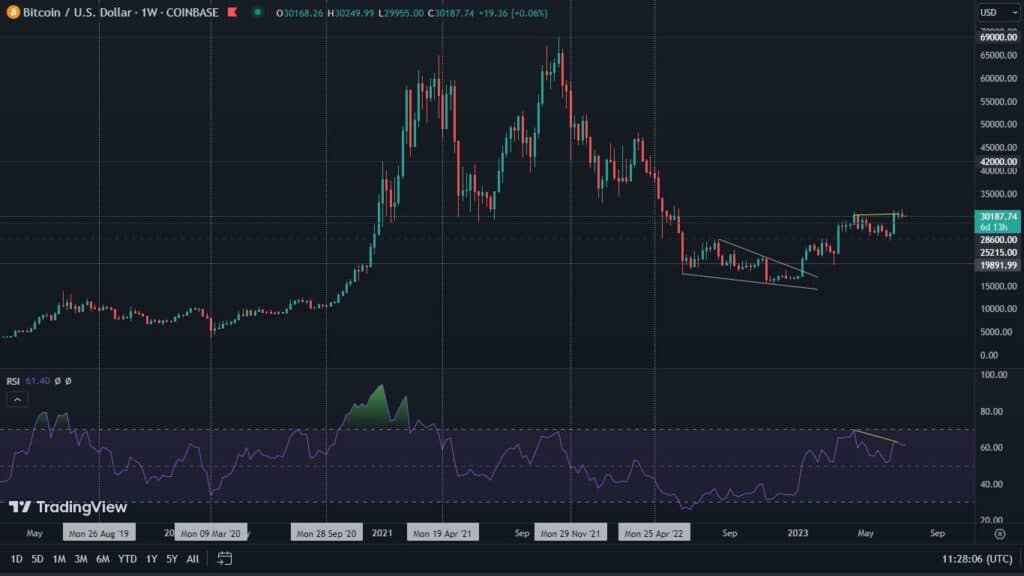
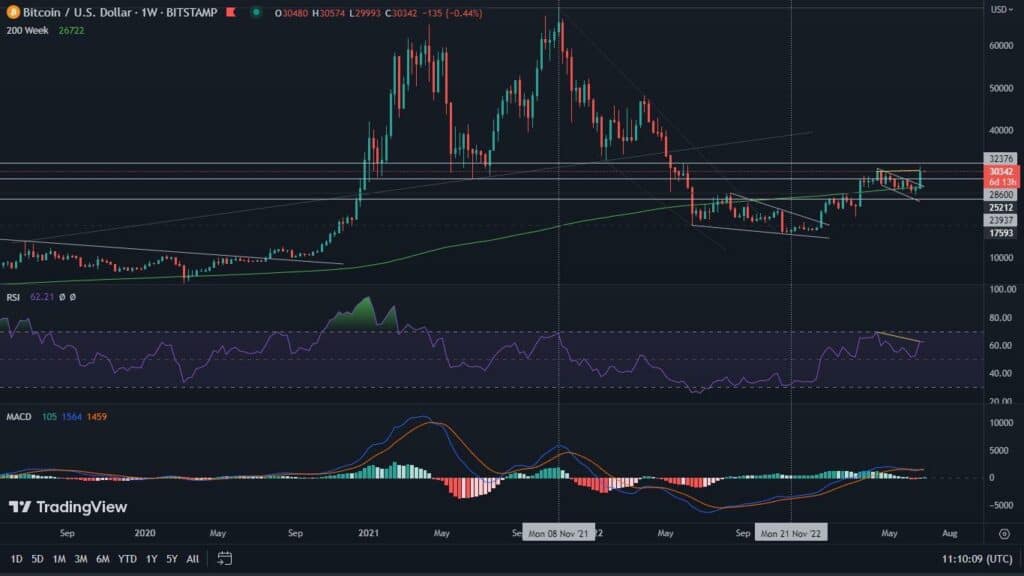
Nevertheless, let’s take a look at the charts and see what they want to tell us. The first, traditionally, is the weekly interval. Here we see an incredible 26.4% increase in Bitcoin’s value. The MACD regained bullish momentum again, and the Stochastic RSI made another bullish cross. The RSI surged above the 65 level, and was followed by volume, which remains very healthy.

Meanwhile, there are also clearly bearish signals. Among them, we see the RSI divergence, which can steadily widen. Also present is a divergence on the stochastic RSI, which, moreover, is in an overbought area. The whole thing is completed by another momentum divergence, which is present between the price and the OBV indicator. All three together have the power to exert a strong influence on the price.
Bitcoin on the daily chart
Much more is able to hint at the daily chart. In the previous analysis we pointed out the support at the level of $22,500 and the considerable chance of a rebound just from this area. Although this was later confirmed by stock market data, the demand for BTC was so strong that the price failed to get there. Because of which the megaphone formation was played out in no time with an upward breakout. Currently, Bitcoin is struggling against horizontal resistance. This is accompanied by a slightly weakening, but remaining high volume. However, the TD Sequential and the bearish divergence of the RSI, indicate the need for a price relapse.
The MACD is behaving similarly, and seems to be catching bearish momentum. All this is happening just before the FOMC meeting and the decision on US interest rates.
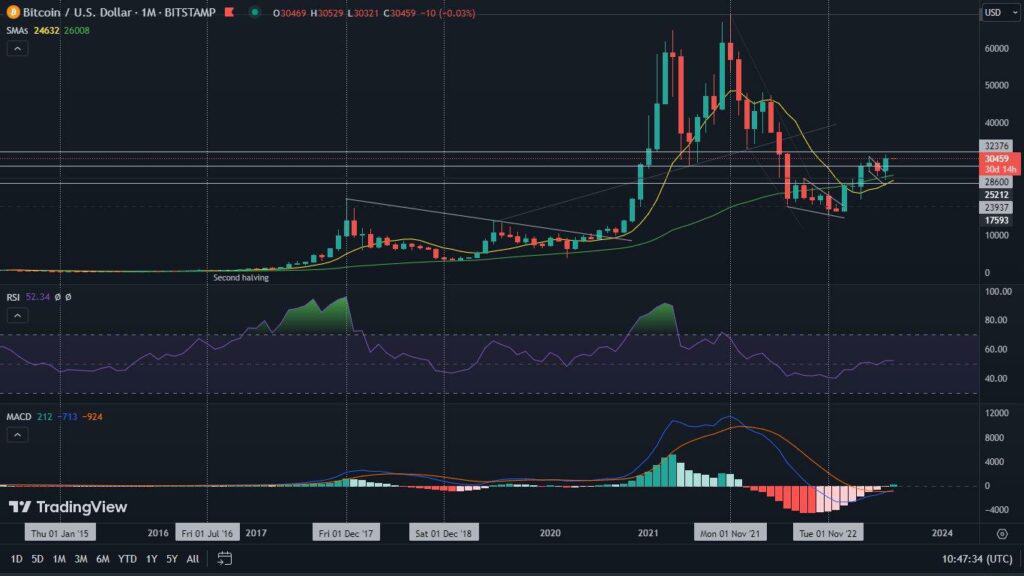
For this reason, we are watching two key levels. In case of declines, this will be the area around $25,200. This is where horizontal support is located, as well as the 200-week SMA. Increases, on the other hand, could result in an attack on $32,375, where the next local resistance is located.
Bitcoin’s dominance reaches key resistance – is it time for altcoins?
Bitcoin’s dominance is definitely one of the most interesting charts to watch at the moment. On it we see that the leading cryptocurrency has reached a level of nearly 48%. Just above it, a couple of weeks ago, we marked a gray rectangle from whose vicinity we expect a rebound. It coincides with local historical resistances. If Bitcoin’s momentum stops in this zone in the near future, there are many indications that there will be a chance for growth in the altcoin market.

