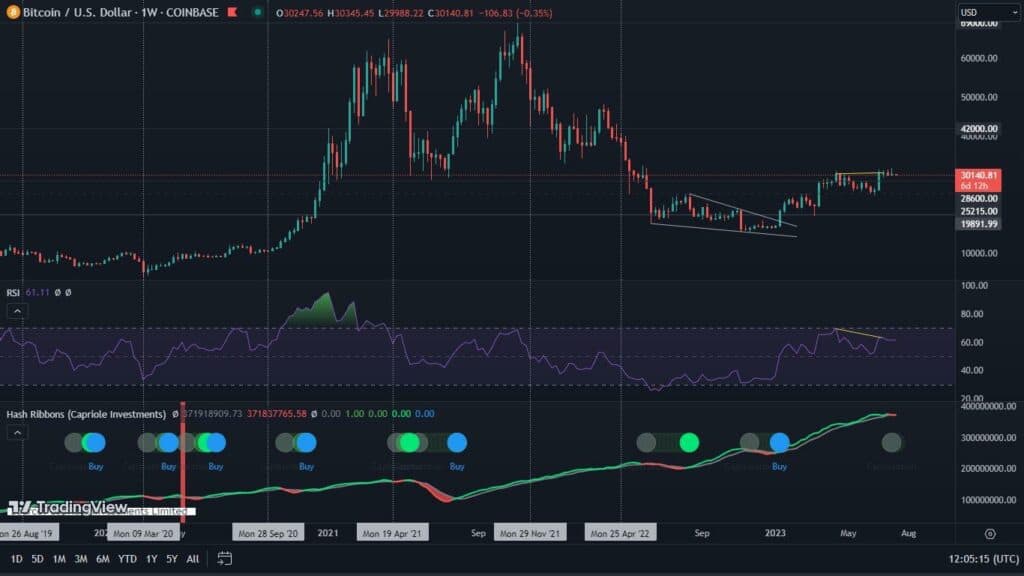
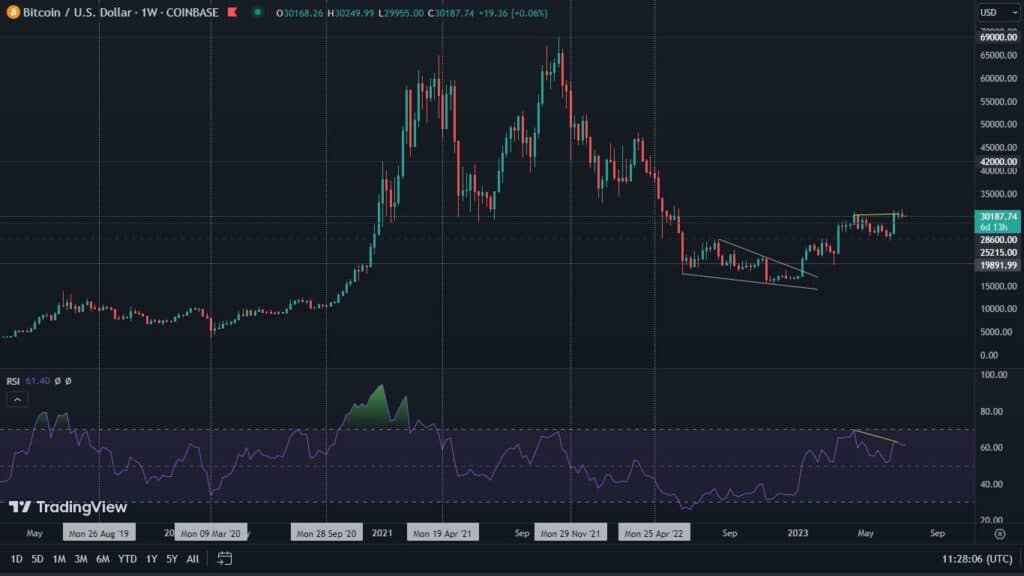
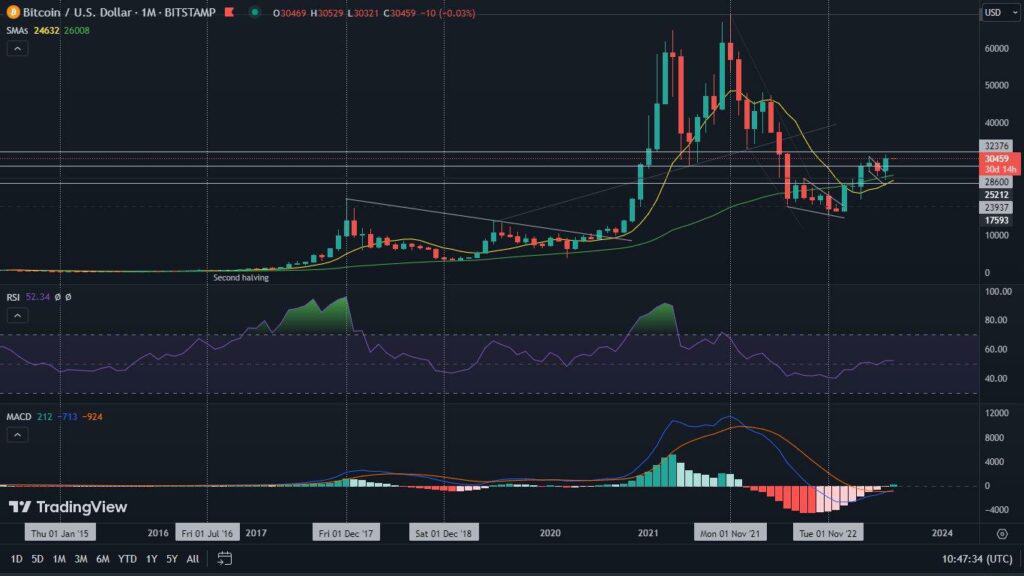
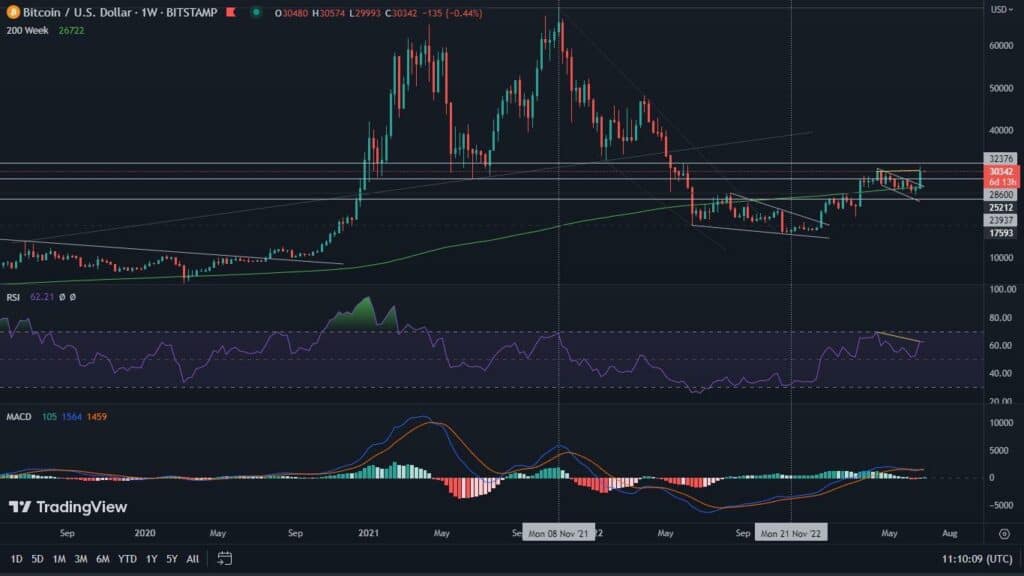
For less than two months, the price of Bitcoin has been oscillating in a wide band between $26,500 and $31,000. Repeated attempts to break out the top of this area have failed. Similarly, there have been attempts to push Bitcoin lower. Nevertheless, one of the two is bound to happen sooner or later. Let’s check which is more likely to happen.
Bitcoin on the weekly chart
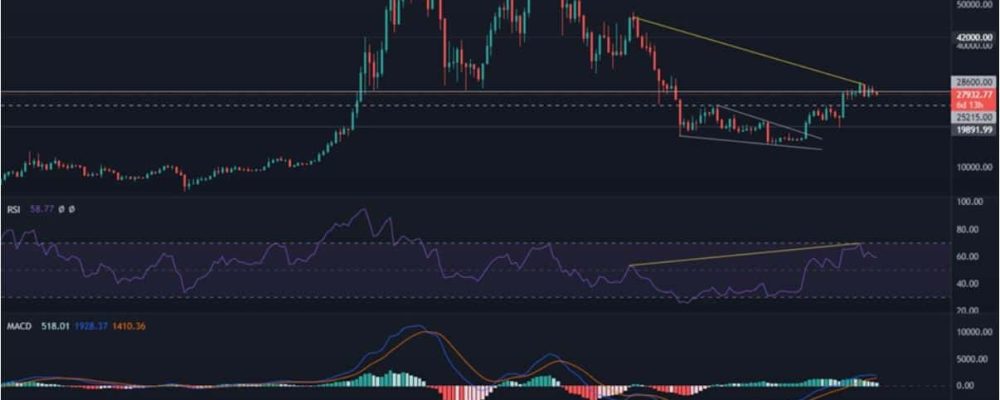
Bitcoin’s weekly chart turns out to be far from presenting us with anything new. On it we see a 2.6% drop in the value of the leading cryptocurrency. At the same time, the RSI presents a bearish divergence, which, as we pointed out earlier, is constantly likely to widen. It is interesting to note that so far the most volatile MACD is showing its third bearish week in a row. On the positive side, however, is the RSI, which maintains its value at a solid level, located above 58.

Bitcoin on the daily chart
March 17 was the day BTC broke into the current price areas. Since then, it has continually remained in them. Every attempt to break out, whether up or down, has ended in failure. At the time of writing this analysis, Bitcoin is after four red days in a row. This is obviously not a good signal, but as you can see, it is still oscillating in a wide band of consolidation. Looking at the indicators, we see that both the RSI and MACD do not show any particular anomalies. The same is true of other factors that we have not already covered here. One of them is volume, which remains low.

Has the combination of RSI and Stochastic RSI set a peak?
We pointed out a few weeks ago, an interesting relationship that has been continuously occurring on the Bitcoin chart since 2017. Every time the RSI on the weekly chart reaches an overbought zone, while the Stochastic RSI, in the same area constructs its second peak, the Bitcoin price reaches its local top. A month has passed since we marked this correlation. Remarkably, BTC has not managed to rise above the then price peak during this time.
Below is a graphic from the analysis published at the time. Although Bitcoin remains in a consolidation, which generally heralds the continuation of an upward movement, the correlation cited here, is right to argue for declines.

Bitcoin’s dominance mapped to price action
Bitcoin’s dominance chart in many respects is a perfect representation of the cryptocurrency’s price action. The daily interval seems particularly similar. Here, too, BTC encounters strong resistance, the breaking of which poses enough of a problem that a prolonged consolidation follows. The difference, however, is that the dominance with each successive rejection of resistance, more steadily remains at high levels. This is not so obvious in the behavior of the price. However, it should be remembered that in the chart below, an upward breakout can occur even in the case of larger market declines in the value of virtual assets.

Will bitcoin follow in the footsteps of gold?
In times of crisis, scarce assets are doing well. This is evidenced by gold, which is hitting new ATHs for the first time in many years. Let’s remember that BTC is also a scarce asset. Moreover, it is called virtual gold. Therefore, there is a good chance that in the long term the condition of precious bullion will intensify demand in the crypto market as well.


