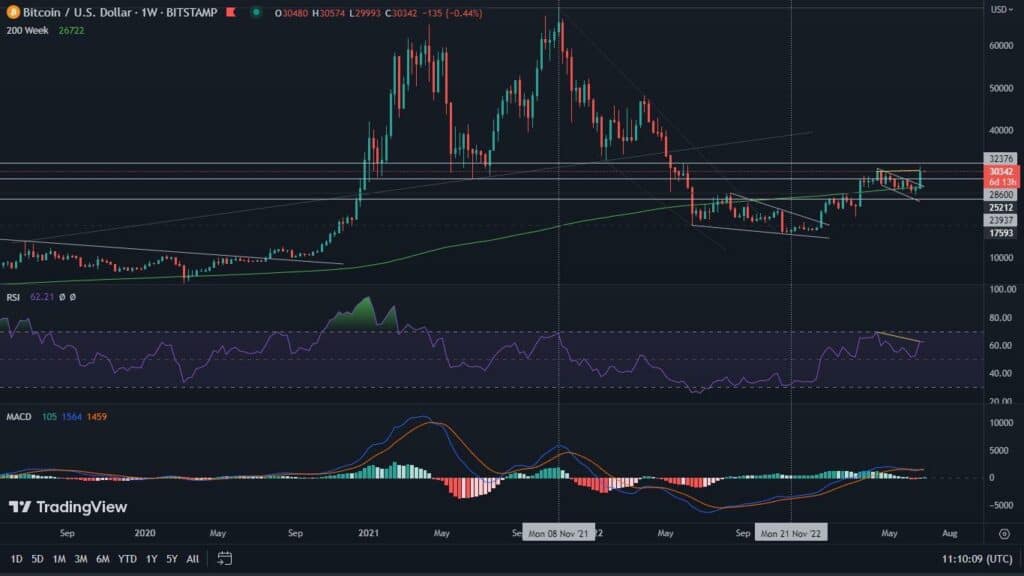
The situation on the Bitcoin chart still remains uncertain. There are indications of a potential continuation of declines. Let’s see if the on-chain data supports this thesis.
Technical analysis for starters
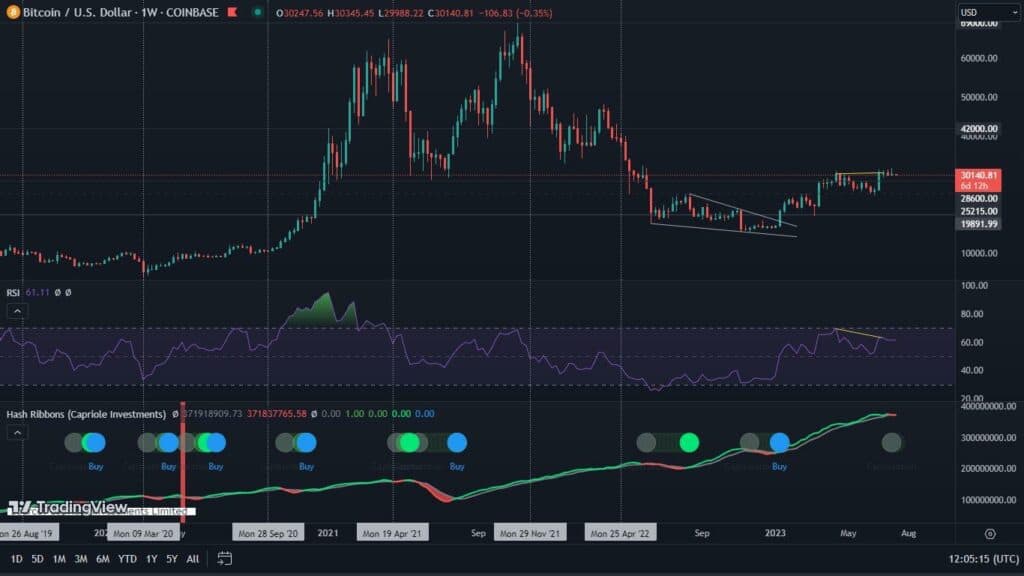
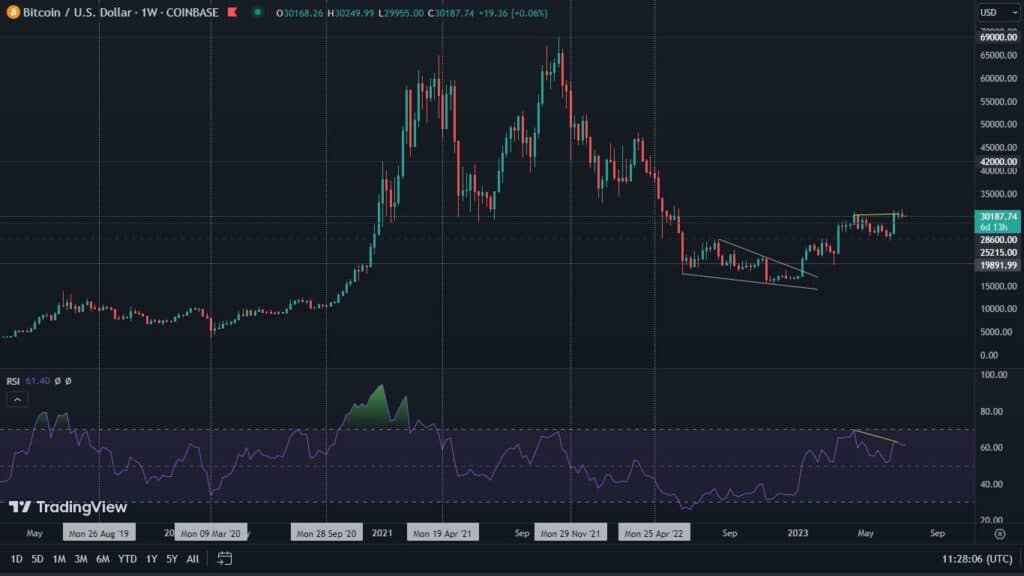
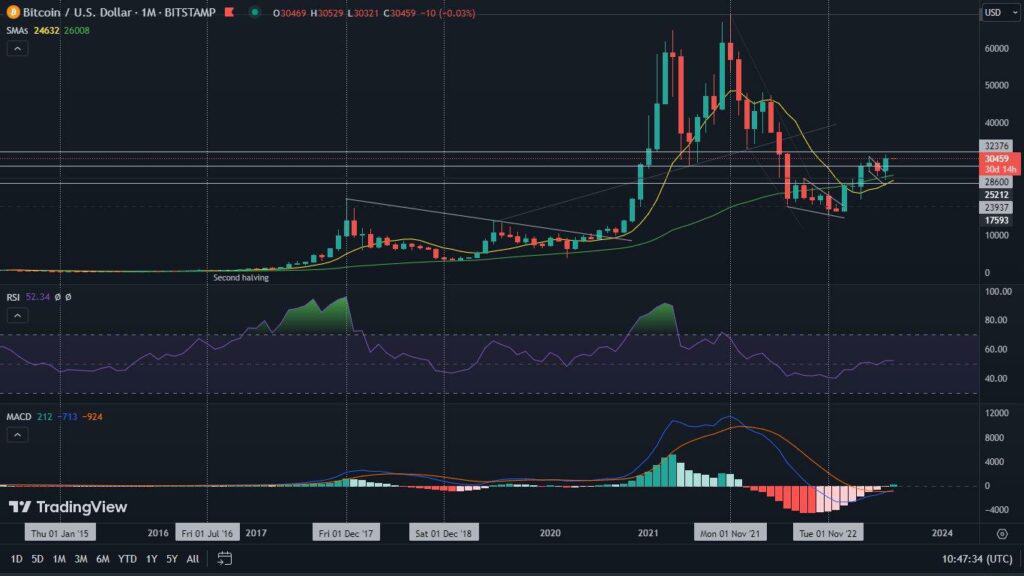
Looking at Bitcoin from a broad perspective, it is worth comparing two periods – the present moment and the same time a year ago. Seemingly they seem very similar to each other. In both cases a peak above $60,000 was reached and a subsequent decline. In 2021, accumulation continued at current price levels. Importantly however, the Bitcoin price has closed below $30,000 just once. Meanwhile over the past two weeks, such a situation has already occurred nine times. This could mean that over comparable periods, Bitcoin is currently looking much weaker.
In the short term, the breakout of the RSI downtrend line may be in BTC’s favor. The stochastic RSI on the other hand, suggests overboughtness, which could result in a further correction.
Bitcoin’s dominance is getting more attention
Before we move on to the on-chain data, let’s turn our attention to what’s happening on the Bitcoin dominance chart. Here, after remaining in a descending triangle for a year, BTC has decided to break out upwards. This means that despite the massive declines, capital is finally starting to flee from the altcoin only now. This is because it was accumulated in stablecoins, which are also classified as altcoins. Their current sale is a signal suggesting that investors are less interested in re-entering the market.
What does on-chain say about it?
Bitcoin reserves on spot exchanges remain at low levels, but this situation seems to be changing. After the steep market declines of two weeks ago, BTC is flowing back into the exchanges, which is a worrying sign.
We are also seeing an interesting phenomenon on the most BTC-rich portfolios. The number of whales holding more than 1,000 Bitcoin is gradually decreasing. This movement is not dynamic, but it may suggest that the whales are not yet in the process of accumulation, in fact they are still waiting for the final capitulation.
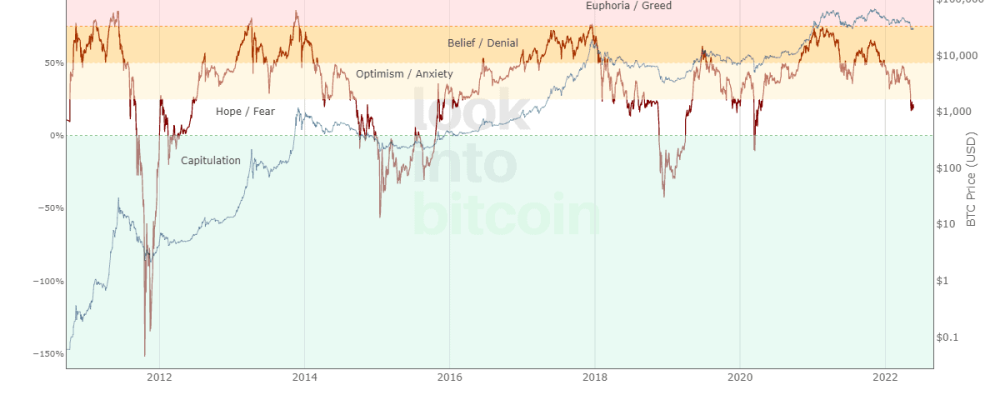
The Net Unrealized Profit/Loss (NUPL) ratio, which we quite rarely cite, may seem quite useful this time. At the current time, bitcoin has found itself in the fear region. Looking back, it has never yet bounced off it enough to enter a new uptrend towards a new ATH. A return to the optimism zone still seems possible, but as history shows, from current levels, a continuation of the downward move is more likely.
MVRV Z-Score seems to confirm this thesis. Although this indicator has already managed to bounce from the level it is currently at in its history, when combined with the others, it confirms that the final capitulation may still be coming.
Finally, we will share a bullish premise. This is undoubtedly the situation on the 1Y+ HODL Wave chart. In this case we see new ATHs reached. Whenever bitcoin gained them, the accumulation process came to an end and at the same time the growth period and the distribution period that followed it began.
To sum up, the accumulated data seems to support the bearish scenario, in the face of which there are single positive signals. At the same time, it is worth remembering that in situations of extreme fear the bottoms of corrections were often reached, and this is where the market is now.

