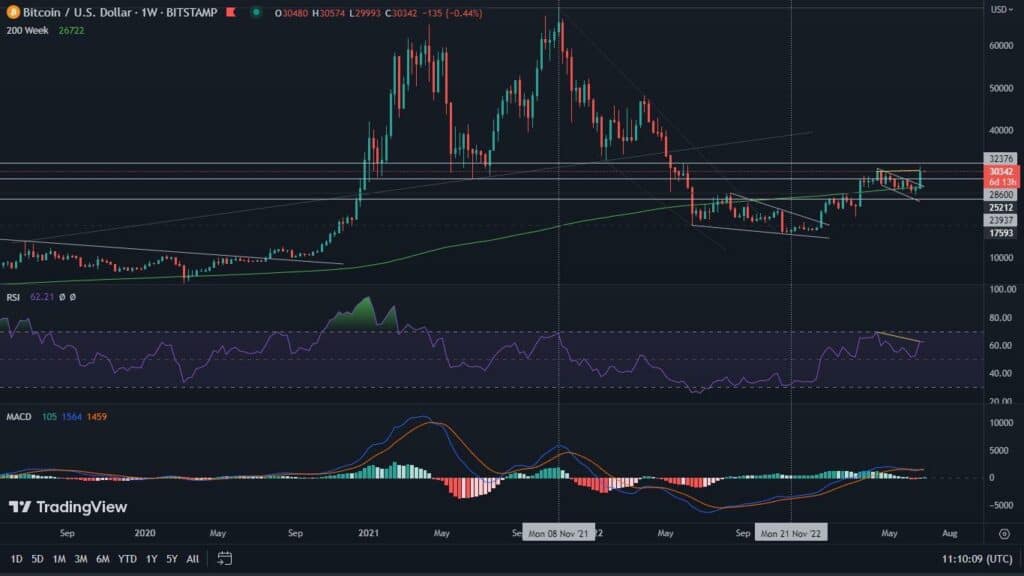
Short-term analysis can often make you shudder. Daily news, both positive and negative, puts the Bitcoin price in dynamic upward as well as downward movements. This is desirable for traders. Meanwhile, BTC Hodlers pay attention to the macro charts, and it is these charts that we will look at in this material.
Elongating cycles?
Hypotheses suggesting Bitcoin’s elongating cycles, with an increasingly lower parabola of increases, are increasingly common in the public space. It’s hard to disagree with them, as after halving in 2012 and 2016, cycles lasted 52 weeks and 75 weeks, respectively. The current cycle, measured from the same point, gives us a count of 84 weeks already.
In response to this theory, price models, based on a logarithmic scale, are created that perfectly reflect the long-term movement. One chart worth relying on is BLX, which does not take into account the price of Bitcoin on a particular exchange, but takes into account data from real transactions.
Fran Strajnar, as one of its co-authors, analyzes it for potential longer cycles as well as peaks and bottoms in valuation. Based on the data he presents, we see that the peak point of the current cycle could occur in 2022. Importantly, this projection was not made yesterday, but back in 2019. The potential peak valuation indicates the vicinity of $100,000. In view of the previously presented data on the length of previous cycles, this vision is justified.
What the technical data tells us on a classic chart
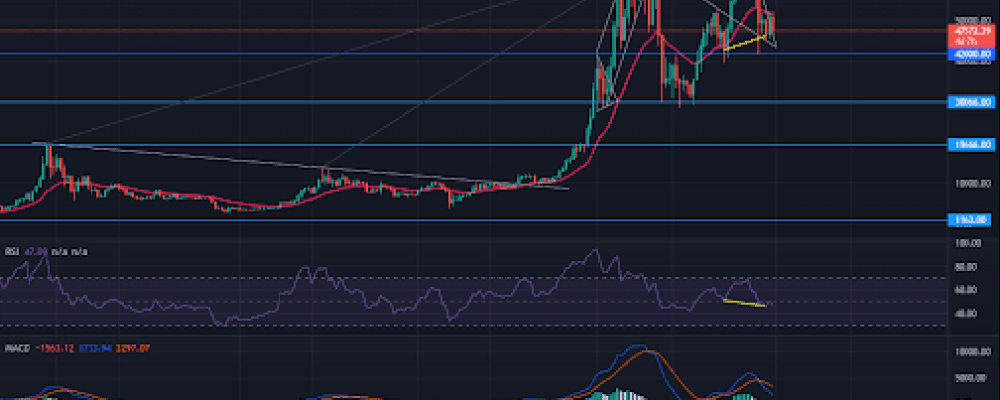
Bitcoin on a weekly scale looks healthy. Clearly higher highs and higher lows come to the fore, which confirm the continuation of the uptrend. With the horizontal blue lines, we have delineated any flat regions of support and resistance that have played significant roles so far. For the moment, we can certainly admit that bitcoin is freely moving between them, making further tests. Following the current trajectory of movement, we can see that the next long-term breakout should take the BTC price to the areas around $65,000. A possible loss of strength by BTC could mean a potential move towards $42,000.
Theoretically, the pink-marked 20-week moving average, which is also an important support and resistance point in the eyes of traders, could stand in the way of the upside. However, the current cycle differs from the previous ones in that the Bitcoin price has already managed to dive below the indicated average, and yet a few weeks later it broke it upwards again. Therefore, a similar scenario could occur.
The RSI divergence presents itself to us bullishly. When it occurs on the weekly scale it is much stronger than on the daily scale. Divergences strongly indicate the potential for a price movement reversal, but they do not indicate the exact point. Divergences, when extended, tend to make the anomaly more powerful in influencing Bitcoin’s value.
The MACD, which is in the bearish area, seems to be worrying. It is worth to watch this indicator and look for a reversal on the histogram. It usually heralds a long-term trend reversal. In this case, a similar scenario may result in a very interesting start to the new year 2022.

