The strength of the reaction to the level we presented a week ago leaves no illusions – Bitcoin is experiencing strong resistance, which seems unlikely to be broken through at the moment. In addition, a familiar pattern appears on the chart. Are we therefore dealing with a Wyckoff accumulation phase?
Bitcoin on the weekly chart
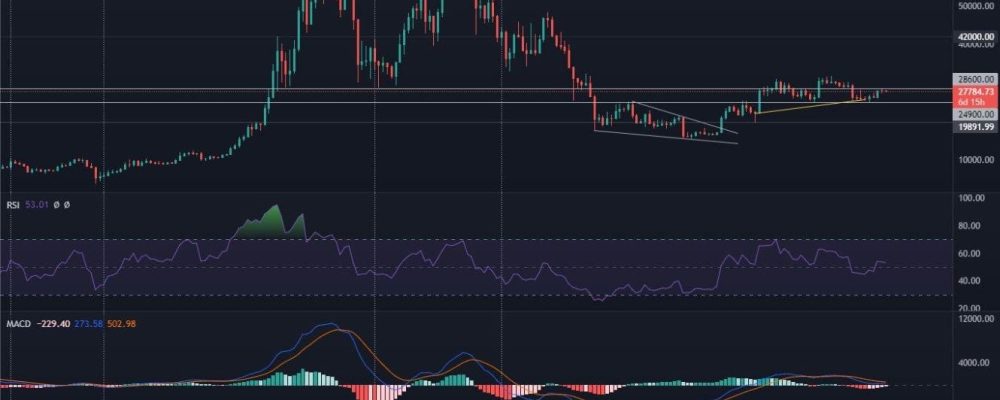
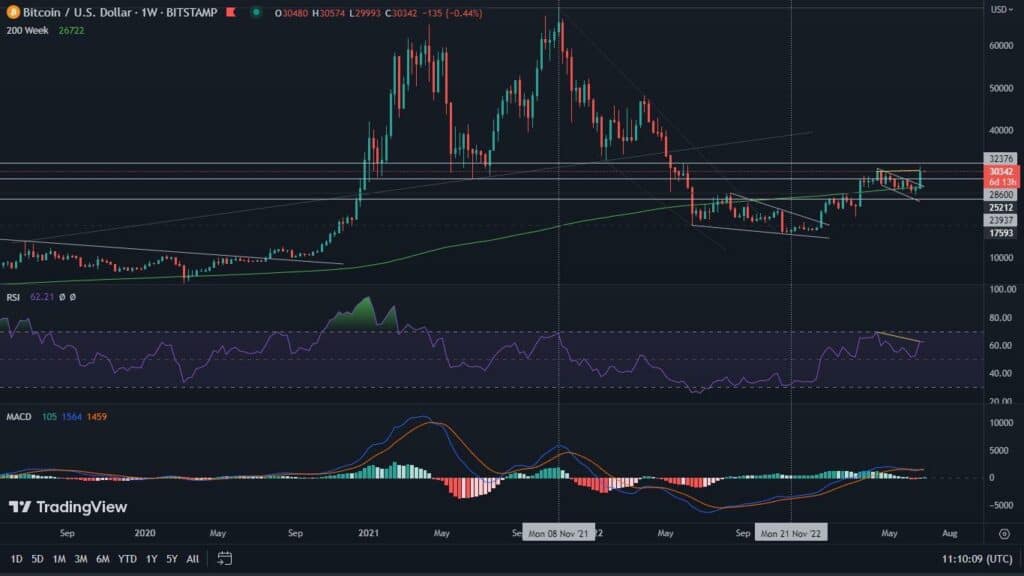
Of all the material we have decided to present today, Bitcoin’s weekly chart seems to be one of the least interesting. All because of the relatively small changes we observe on it. Although last week BTC ended in the red, the value of this decline was barely 0.2%. Thus, the level of $28,600 was once again confirmed as resistance. In addition, it was set with a very precise and strong reaction.
Nevertheless, this is the only negative information we are able to acquire. Besides, Bitcoin managed to keep the RSI at a high value of 53. As we know, it favors the bullish side. MACD, on the other hand, despite rejecting an important horizontal area, was still able to maintain bullish momentum. Thus, looking from this perspective, we are easily able to identify the current support level, which is $24,900.
Bitcoin an intraday chart
Much more developments are taking place on Bitcoin’s daily chart. At the time of writing this analysis, we can observe that the CME gap formed a week ago is just being filled. At the same time, the first bullish divergences are appearing. One of them is revealed by the OBV indicator. The second, on the other hand, may soon become a reality on the RSI. However, for this to actually take place, the price of the leading cryptocurrency must go even lower than it is now.
The analysis is also worth supplementing with MACD. We can clearly see that this indicator is experiencing a bearish cross. The same thing is happening between the 100- and 200-day moving averages. On the chart we have marked them with a yellow and green line, respectively. Staying within these averages, we can assume that the 50-day SMA (red line) may become a temporary support level.
Is bitcoin currently in a Wyckoff accumulation phase?
Just two years ago, the topic of the Wyckoff accumulation phase was constantly featured in all the analyses of Bitcoin available on the market. Could it be that the leading cryptocurrency is about to experience a similar scenario again? Hypothetically, there are some grounds for this.
Below is the current situation of Bitcoin juxtaposed with one of the accumulation patterns according to Wyckoff. They are definitely not identical, and far from perfect. However, if they were the same, it would be an obvious scenario, and the market likes to create uncertainty. Therefore, given that bitcoin in its life cycle is currently in the period of several months before the halving, which in turn has been the catalyst for the bull market each time, a period of accumulation, or re-accumulation, finds strong justification. The pattern is therefore entitled to fulfillment. Following its pattern, bitcoin should now be in its middle phase.
Momentum for altcoins
Bitcoin’s dominance reaches a very important level and loses contact with it. The 200-week SMA (blue line) is once again acting as resistance. Thus, there is an emerging opportunity for selected altcoins to rise. Nevertheless, the proximity of the 100-day SMA (yellow line), to which BTC has always reacted strongly, suggests that the altcoin’s time will not last long.

