Bitcoin, depending on the observed time interval, sends a number of diverse signals. Nevertheless, on the daily chart it is making a rebound from the level we have been observing for a long time. So, is this a chance for more growth, or just a short-term breath of hope?
Bitcoin on the monthly chart
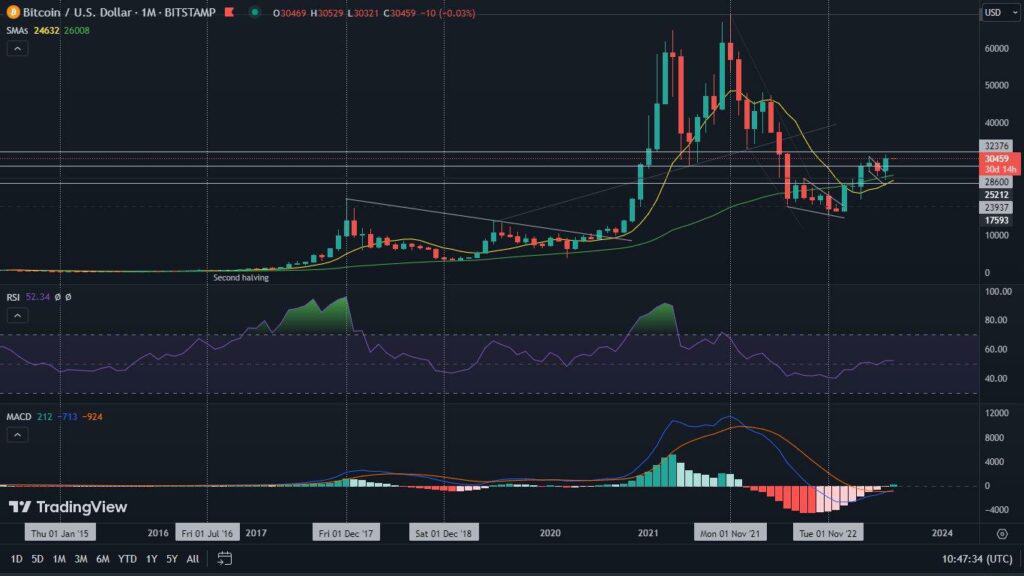
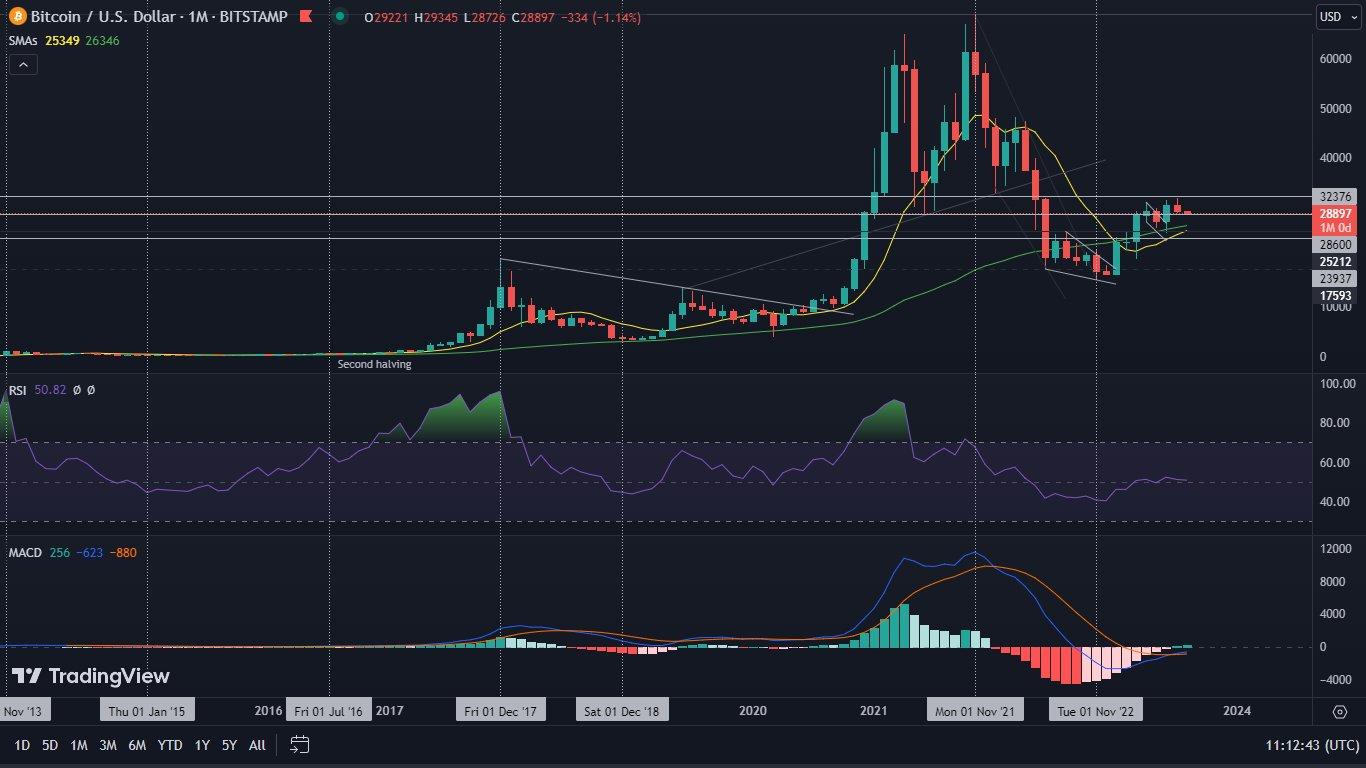
July has ended, and with it Bitcoin has lost 4.05% of its value. This does not seem like much, but it is worth noting where the rejection occurred. We are talking about the upper limit of the resistance zone, which has been extremely difficult to break through for a very long time.
There are also positive factors emerging. First of all, the RSI value remains in a healthy space, recording a score of 51. For the sixth time in a row, the price is oscillating above the MA10, and for the fifth time above the MA20. Despite the relative stagnation of the cryptocurrency’s value expressed in dollars, this fact confirms the maintenance of bullish momentum. The most important factor, however, is the confirmation of a bullish MACD cross. On the monthly interval, this is an extremely rare occurrence. There have been times when it has suggested further increases. However, there have been times when this indicator also reported a local peak. Such a situation occurred in 2019, when BTC was recovering from deep declines resulting from an ongoing bear market.
Bitcoin on the weekly interval
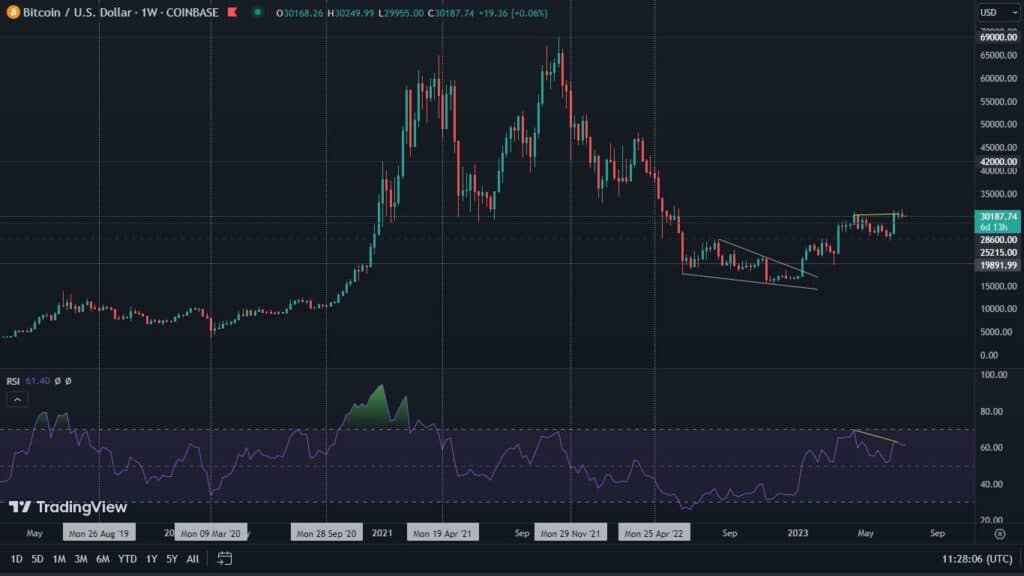
On the weekly chart, on the other hand, Bitcoin is down nearly 2.7%. The RSI still maintains a local bearish divergence. The MACD, which is close to making a bearish cross, looks disturbing. However, we still have to wait a bit longer for its confirmation. Meanwhile, the RSI value remains at 57, which strongly favors the bulls. The BTC price, meanwhile, finds support at the 10-week moving average, which has the right to become a rebound platform for further increases.

Bitcoin on the daily chart
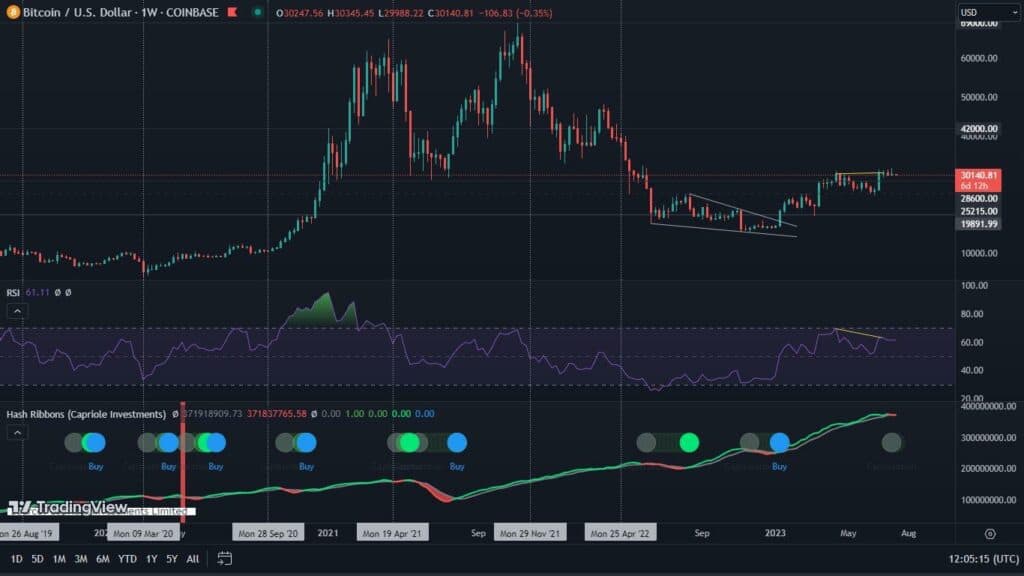
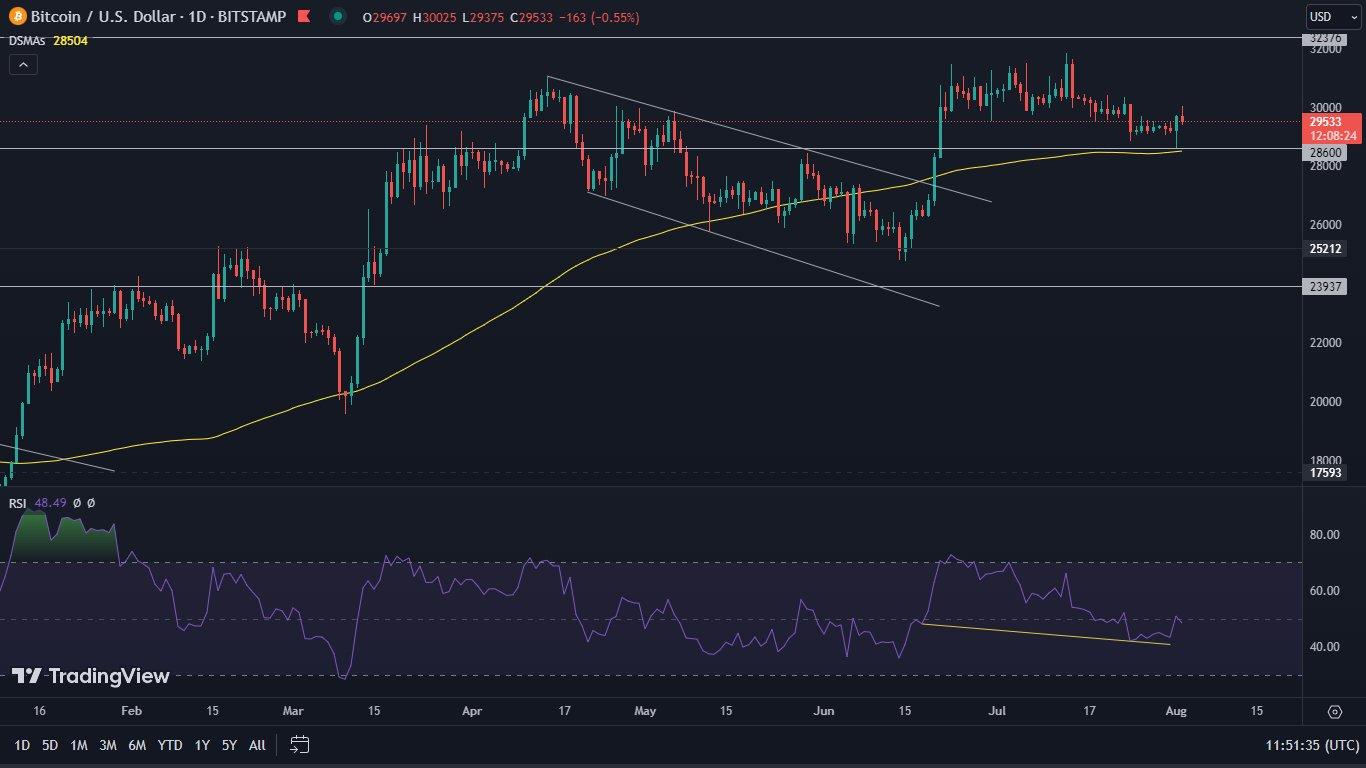
What is most interesting, and also bullish, is happening on the daily chart. It is here that Bitcoin has made a rebound from the $28,600 level, as well as from the 100-day moving average. Recently, we have been paying attention to this price region, as well as the mentioned indicator, very often. Their convergence had the right to give strength to the rebound that has just taken place. The whole thing was completed by the bullish divergence of the RSI.
Thus, there is a probability that Bitcoin has reached a local bottom and will look for a chance for further increases. However, in order to become more convinced of this, it is worth watching the indicators. It is their behavior that can tell us whether the currently observed price action is a so-called short-term pump or the beginning of a sustainable upward movement.
At the same time, it is worth noting that a possible loss of the 100-day SMA, may indicate further declines. However, there is no need to become bearish as long as the Bitcoin price remains steadily above.
Let’s add that the Hash Ribbons indicator we are watching still does not send a buying signal. Nevertheless, we are constantly watching over it and as soon as its situation changes, we will inform you.
Bitcoin’s dominance reacts to an important level
The 100-day SMA is important not only for Bitcoin’s price, but also for its dominance. It is in its vicinity that BTC has regained control of the market and is trending upward. Dominance is clearly supported here by the MACD. The altcoin season is therefore pushed back.