Strong selling pressure has caused Bitcoin to once again fall below its 2017 peak. At the same time it is losing an important level on the dominance chart. Are altcoins taking the initiative?
Bitcoin on the weekly chart
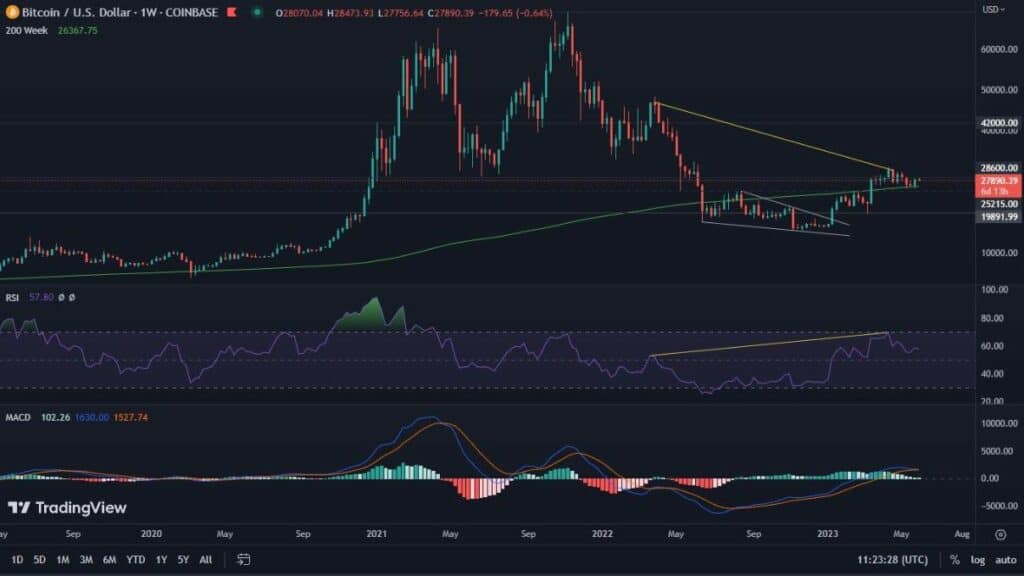
A few weeks ago, we pointed out that Bitcoin’s price action on the weekly chart caused the making of the so-called bullish MACD cross. At the time, we explained that although this indicator is historically very accurate, the probability of upward movements following it, in the current case, is quite low. Currently, we observe that the MACD momentum has almost completely flattened out, moving towards a bearish cross. It is worth keeping this factor in mind, as it may suggest the coming of new minima or even the reaching of a valuation bottom. We will say more about it when the bearish cross is made final.
Meanwhile, the current situation on the chart is also driving a significant RSI divergence. If the week closes at similar price levels as we see today, the RSI will thus be oriented in the opposite direction of the price action. In doing so, the indicator will be in close proximity to the oversold area. This bullish divergence has the right to result in upcoming increases. However, it is necessary to wait until Sunday’s market close to confirm it.
Bitcoin on the daily chart
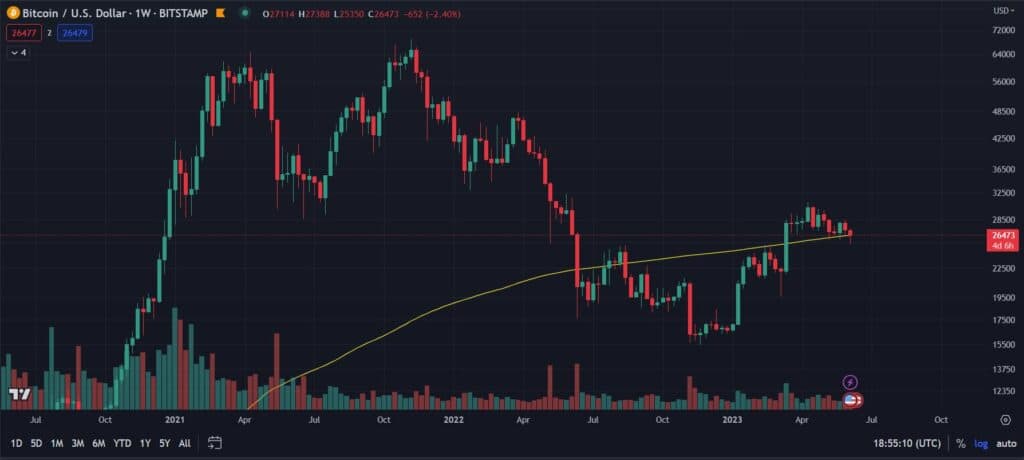
Here, in turn, BTC is experiencing a very interesting event. Well, after Tuesday’s declines, the daily candle closed at this year’s lowest level. Moreover, this value, at $18,669, is the lowest close since December 2020.
As a result, the potential bullish cross that was forming on the MACD indicator was negated. This reinforced the bearish momentum. At the same time, a bullish divergence appeared on the RSI. Its presence may reinforce the rhetoric of a temporary trend reversal. However, further declines could easily negate it. Nevertheless, Bitcoin is currently in a support zone, just below the 2017 peak. From a technical point of view, this is a very significant area. Therefore, it will not be surprising if the bulls struggle to regain levels near $20,000.
Key metrics reset
If you’ve been following us on Twitter, you probably noticed that at the end of last week, we pointed out a very important fact. Metrics such as Net Unrealized Profit/Loss (NUPL), Puell Multiple, MVRV Z-Score and RHODL Ratio were all in the capitulation zone. Moreover, they all did so at the same time. Historically, such events have suggested the proximity of a bottom in Bitcoin’s valuation. Thus, a reasonable assumption emerges that the same may be true this time as well.
Net Unrealized Profit/Loss (NUPL), Puell Multiple, MVRV Z-Score and RHODL Ratio are all currently in the capitulation zone. Historically, this is a great buying opportunity for #Bitcoin #Crypto pic.twitter.com/mAGZ5ZGQbG
— Blockbulletin (@Blockbulletin_) September 2, 2022
And if you are not yet following us on social media, be sure to start. We publish a lot of interesting material there, as well as hot news. Stay up to date!
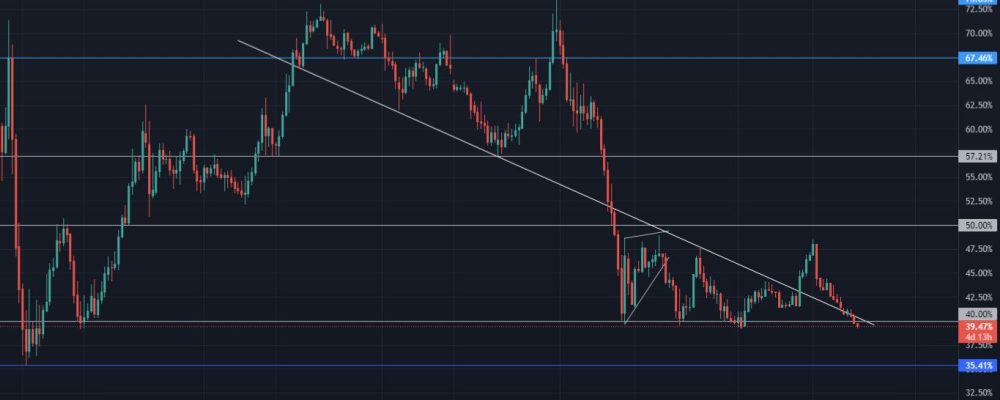
Bitcoin’s dominance lowest since February 2018
Despite the fact that the cryptocurrency market has been experiencing continuous declines since last November, Bitcoin’s dominance is behaving quite unusually. As a rule, it has clearly increased under similar conditions. Meanwhile, at the time of writing this text, it is recording a minimum, last seen in February 2018. This situation is undoubtedly driven by Ethereum and the Merge, announced for September 15. If the current breakout is not false, we may witness an attempt to attack the 35.5% level.

