Bitcoin has broken through the $30,000 level and is attempting to hold above it. Although some indicators suggest exhaustion, others are optimistic about a potential continuation of the upward movement. So what should be expected?
Bitcoin on the weekly chart
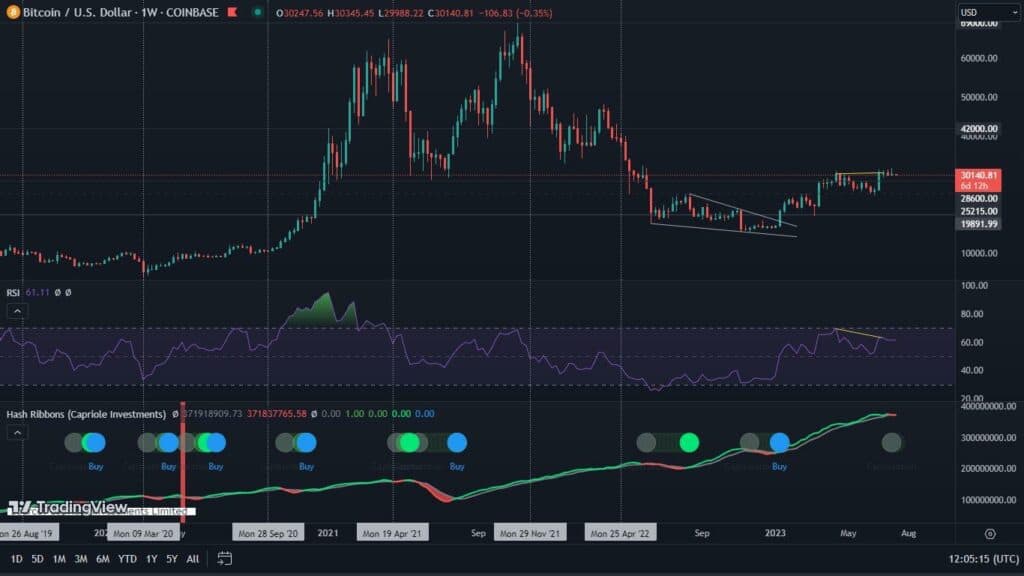
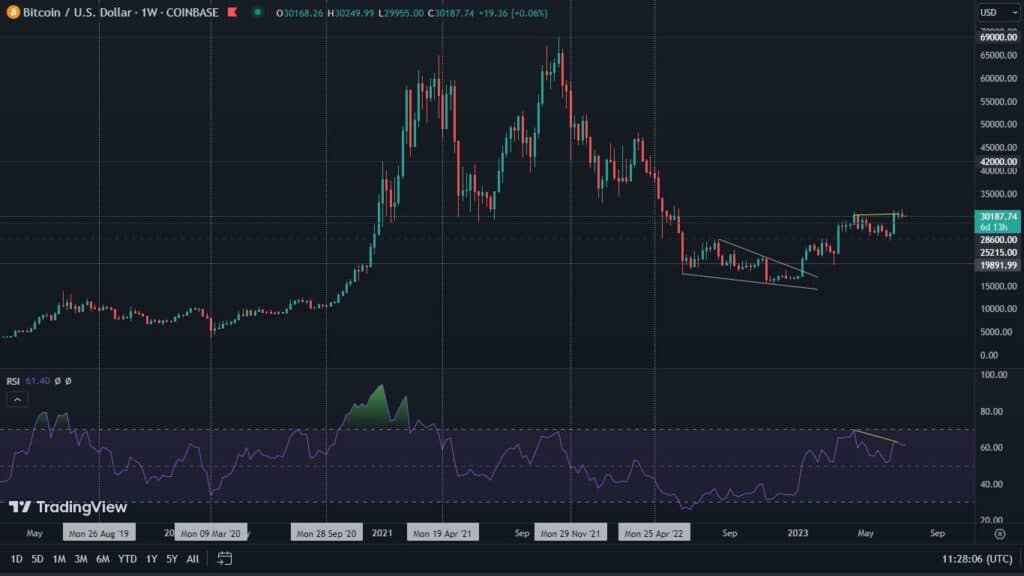
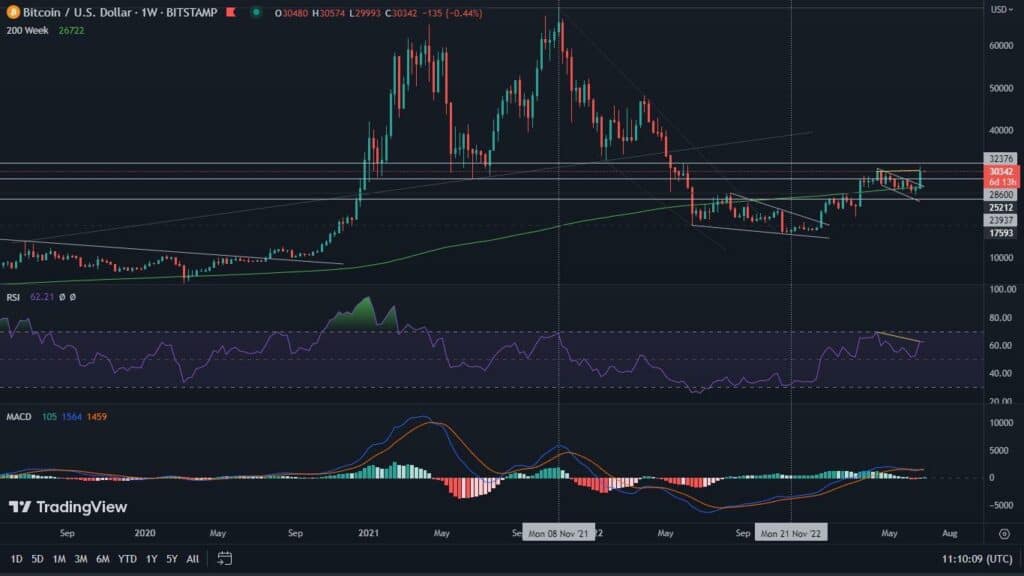
The past week brought a huge jump in the value of BTC, amounting to 15.7%. Thus, the leading cryptocurrency rose clearly above the level of the 200-week moving average. The RSI also recorded a dynamic rebound, rising above the level of 62. Meanwhile, the memory of the bearish MACD cross seems to have faded completely, as the indicator is trying to resume a positive trajectory and is heading towards a bullish cross.
The negative aspect of the weekly interval, on the other hand, is the newly formed bearish RSI divergence.
Bitcoin on the daily chart
Recently, the candles on the daily chart of Bitcoin are making this year’s highest closes. This clearly shows the strength of the cryptocurrency, which process of its consolidation is moving to higher and higher levels. Given that BTC is currently in an uptrend, this potential accumulation could herald another breakout. Before that happens, however, a gentle cooling is not out of the question.
A period of rest under the dynamic rally is heralded by the TD Sequential indicator, which this past Saturday, broke out its ninth directional candle in a row. In such cases, a correction usually follows, which can also take the form of consolidation. It is natural, therefore, to look at the formation from which BTC broke out, and the 100-day moving average appearing just above it.
The area between the top of the channel and the moving average is a natural demand space (gray rectangle). In the event of a possible correction, this is where the next bounce could occur.
A very positive aspect is the behavior of the ADX indicator. We can clearly see that it classifies the ongoing movement as strong. So consolidation in the current price range and an upward breakout of the price seems to be a matter of time. Resistance will be overcome when Bitcoin overcomes and holds the horizontal level of $32,400.

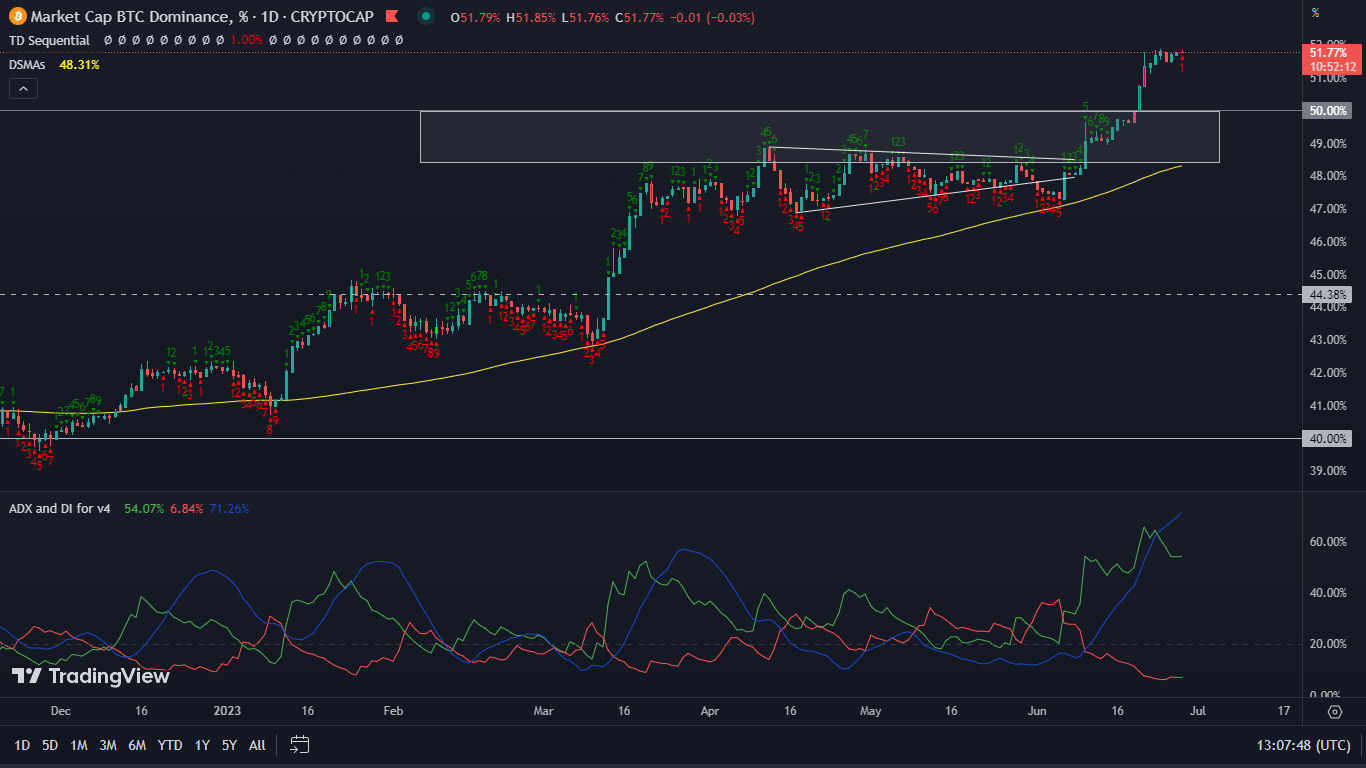
Bitcoin’s dominance reaches an important level
Bitcoin has successfully overcome the psychological barrier and raised its dominance to 52% of the total value of the cryptocurrency market. Looking at it historically, this is an important but hardly local resistance. Nevertheless, it is accompanied by exhaustion, which is signaled again by the TD Sequential indicator.
Thus, another consolidation, or even a correction, is not excluded. Interestingly, the latter may be supported by the ADX indicator mentioned earlier. It has exceeded the level of 71%. In the past, these values have been the limits for upward movements. In such a case, a pullback and cooling of the indicator seems almost necessary. If this scenario were to materialize, a decline in Bitcoin’s dominance to 50%, or to the 100-day moving average, which as we see has often been a support, seems very possible.
Is this the time of altcoins?
A situation in which Bitcoin reaches such high levels of dominance, with clear indicators of exhaustion of movement, may suggest a transfer of upward force from the leading cryptocurrency to altcoins. For the moment, however, it is difficult to expect a decisive altcoinsession. Nevertheless, many of the smaller coins may experience a temporary surge. Most likely, it will not last long. However, it is worth remembering that altcoins against both the dollar and Bitcoin have been suffering a lot recently. It seems highly likely, therefore, that a period of slight relief is coming for them.