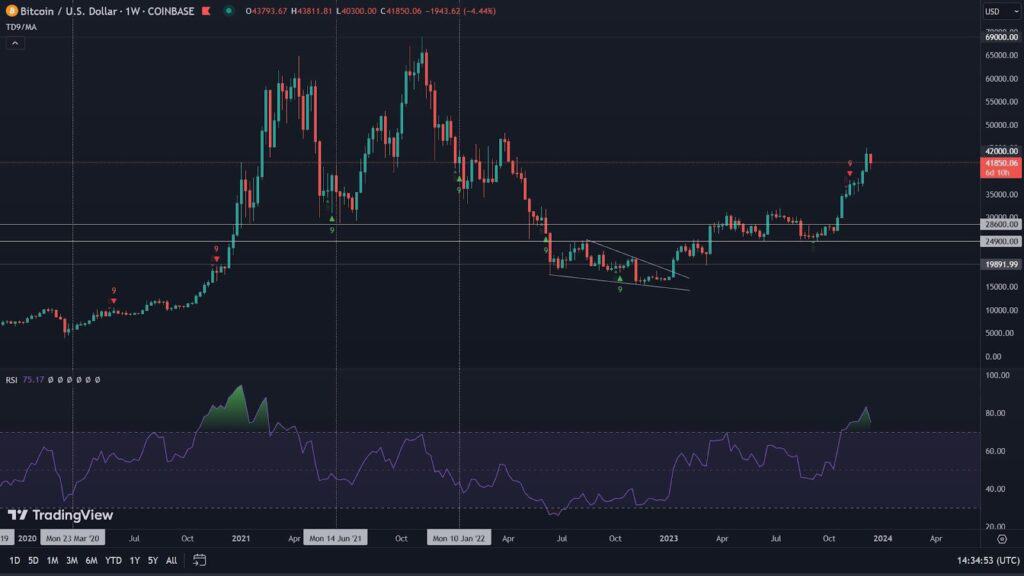
A powerful plunge in the cryptocurrency market resulted in Bitcoin dropping to $42,000. However, we are seeing a rapid redemption of the decline, allowing most smaller coins to catch their breath as well. What are the possible scenarios for the coming time and whether we are in for an altcoin season – we will answer these questions below.
Let’s start with Bitcoin
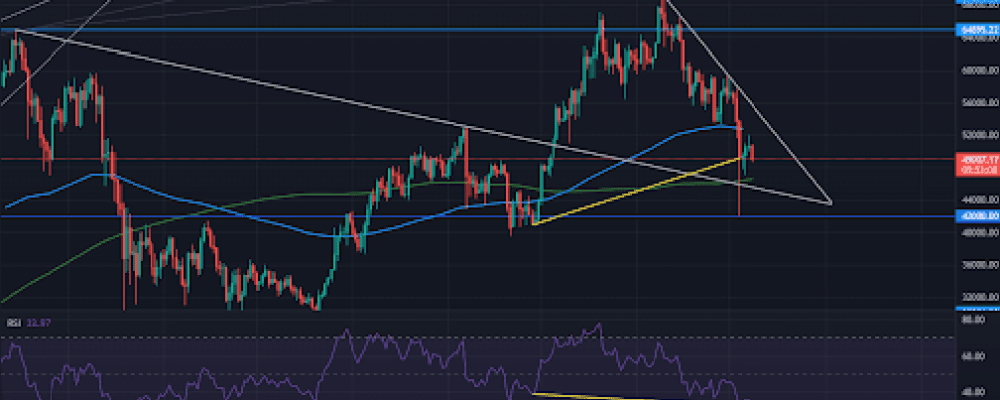
December 4 turned out to be an extremely bloody day on the market. The leading coin deepened its decline from $69,000 to the level of $42,000, recording a total correction from ATH exceeding 39%. These declines proved to be a real bargain for many investors, and as a result, we saw an instant rebound in price and Bitcoin’s renewed fight for $50,000. The indicators present an interesting picture.
Let’s start by determining resistance and support. When we connect the peak from April, along with the local peak from September this year, we see a strong support level, above which the price managed to close during the declines. This trend line also coincides with the 200-day moving average (green line), which is also and key region protecting Bitcoin from further downward movement. Looking for resistance, on the other hand, we also see two areas. The first is the downtrend line from the ATH, while the second is the 20-week exponential moving average (blue line). Bitcoin managed to close the week below its level, which fills the market with uncertainty. Therefore, the current week may be crucial and in order to maintain a stable uptrend, it will be necessary to break below this average again before Sunday’s close.
The aforementioned trend lines form a bullish pennant formation. This in turn is supported by a bullish divergence on the RSI (marked in yellow).
What can we expect before the end of the year?
If Bitcoin is able to close the current week above the 20-week moving average, we can expect a quiet attempt to return to a sustainable uptrend path. We will then take a closer look at the Fibonacci retracement and determine if a $60,000 recovery is possible.
Keep in mind, however, that such dynamic declines as we are currently seeing, with candle wicks that are extended downward, often seek a renewed, somewhat calmer fill. Hence, another descent into the $42,000 area is still possible. It is therefore worth watching the 200-day moving average and the reaction to this level.
BTC domination. Is it time for alts?
One chart that is getting more and more attention is the dominance of Bitcoin. A few weeks ago, we drew a white trend line on it, which the market is respecting all the time, affecting the decreasing strength of BTC. Thus, a descending triangle formation is formed, and at the same time an attempt to break through the psychological barrier of 40%. However, it is possible to have one more bounce and thus increase the dominance of the king of cryptocurrencies. If, on the other hand, there is a breakout from the formation towards the bottom, altcoins may regain their time to push Bitcoin towards the historical limit at 35.41%. This makes sense as the market is in a correction, and that correction has often resulted in BTC cooling off and opening the way for smaller coins.
Ether has already decided
Meanwhile, the second most popular cryptocurrency, has broken out of the formation against Bitcoin, opening the way for further gains. The RSI for ETH against BTC remains unfavorable, which may indicate an upcoming retest of the breakout level. Nevertheless, it is worth watching the pair in the context of further moves, as the eventual altcoin season, may depend on the strength of Ether just on this chart.

