Ethereum does not cease to amaze. The second largest cryptocurrency by market capitalization, sets another ATH!
The situation on the ETH/USD chart
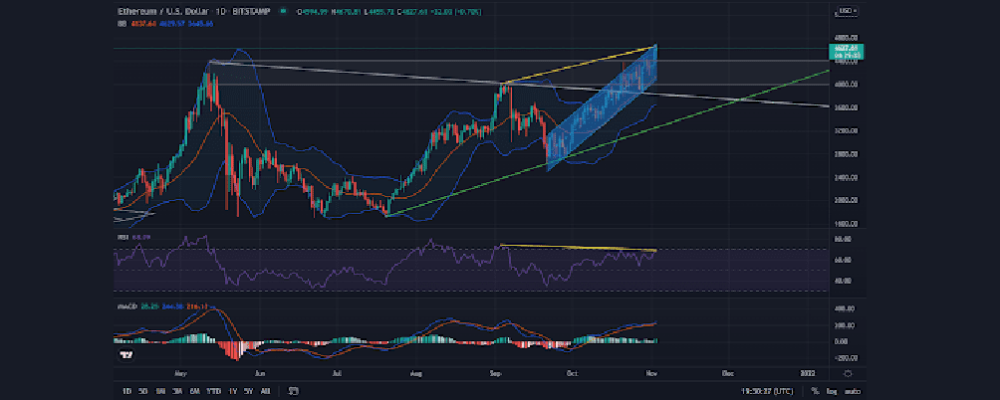
The day Bitcoin hits $69,000 is also the day Ether once again records a peak in its value. This time, it has reached the $4,870 level. As we pointed out in the previous material, ETH has been moving in an upward channel, which is still being maintained in the current situation. We can also observe a delicate correction, which brought the price of the king of altcoins to the gray area that we determined, from which in turn we observed a rebound. It is worth noting, however, that the current price action did not reset the bearish divergence on RSI, which still points to a possible stronger downward movement (yellow lines). Instead, it has been extended, which could result in a possibly stronger correction. The MACD is also becoming weaker and even in its case, the histogram suggests a reversal of the price direction.
Potential resistance and support levels remain unchanged. The vicinity of USD 5,000 as resistance, resulting from the breakout of the bullish flag discussed in earlier materials. And support marked by the region between the May and September peaks (gray rectangle) and trend lines. In this case both downward (white line) and upward (green line).
On-chain bullish
On-chain data for Ether remains very healthy. The statistics on the amount of Ether held on exchanges are particularly optimistic. As in the case of Bitcoin, their number is successively decreasing. The level of 14,241,527,151 ETH was reached, which is the lowest value in 3 years.
The situation on the ETH/BTC chart
There is definitely a lot going on here. However, let’s start with the fact that the fourth quarter was never particularly successful for Ether, relative to Bitcoin. Typically, the second largest cryptocurrency lost to Bitcoin, but in a bull market, it still looked good when paired against the dollar. Meanwhile, we are now looking at ETH, which is doing very well to both BTC and the USD. After the dynamic move in late April and early May, we are seeing a very broad consolidation area. Multiple downtrends have broken out upwards within it, usually after encountering an uptrend line, which we have highlighted here in green.
There was also a very clear downtrend formed from the combination of the May and September peaks. So the support and resistance levels clarify for us quite clearly. The whole thing forms a bullish flag. The breakout of this formation has the right to lead ETH to the record of its value, located at the level of 0.12344999 BTC. The exit of the pennant could happen at the end of the fourth quarter, or with the beginning of next year, when ETH to BTC was just starting to historically make the strongest gains. Meanwhile, we expect an extended period of consolidation and even a short-term decline in ETH, as indicated by the bearishly formed MACD.

