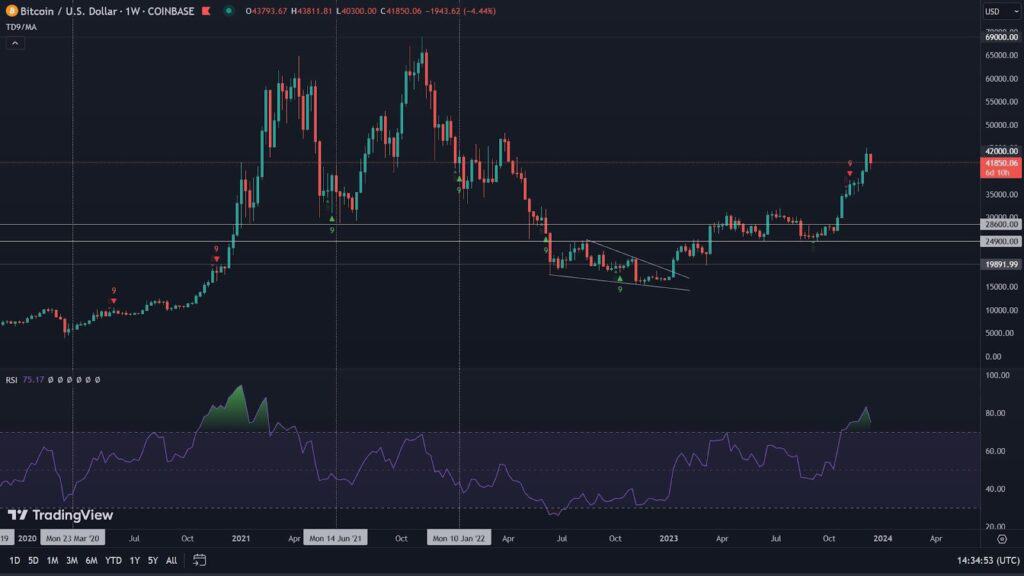
After Bitcoin’s record-breaking nine straight weekly red candles the market is finally recovering. In just one day BTC has gained 7.75%, giving hope for a trend reversal. Could it be that the mood is just shifting, following the optimism in traditional markets?
Moderate optimism
When observing the behavior of the Bitcoin price it is worth keeping a cool head. Breakouts similar to the one recorded on Monday, May 30, were already known to investors observing a progressive downtrend. Nevertheless, such a dynamic increase in the value of BTC fills us with optimism. It suggests a potential break of the multi-week downward trend. Moreover, it is a definite return above the psychological border of USD 30,000, which is closely watched by the whole market.
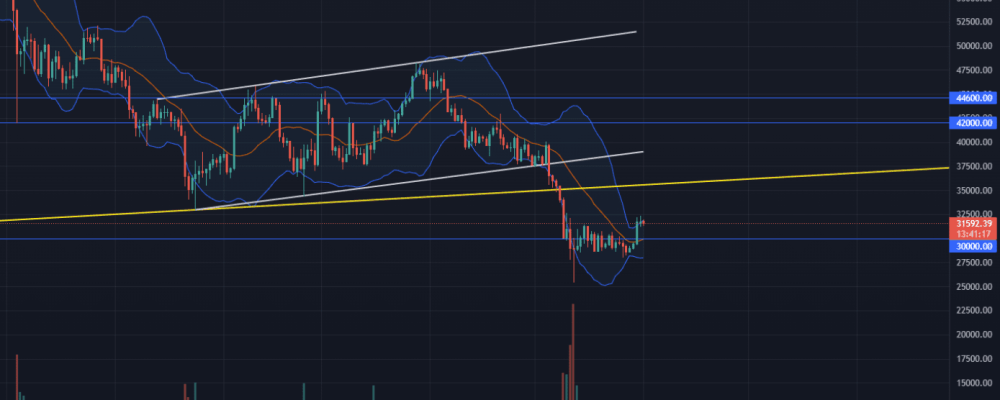
Looking at the chart we can notice several interesting aspects. The first of them is the volume, which still remains low, suggesting rather modest interest of buyers. A positive signal, in turn, is the breakout of the 20-day moving average (orange line) and reaching the upper limit of the Bollinger Bands. Here we see a temporary deceleration of the movement. Maintaining the 20-day SMA may give a chance to attack the long-term trend line (yellow line), oscillating around the USD 35,000 level. Breaking it may result in an attempt to reach the USD 39,000 level, which in turn is the lower edge of the upward channel that was broken in early May. At the moment, possible declines may take BTC to the neighborhood of $25,000, where the recently reached support is located.
Ethereum still weak
The chart of Ethereum is slightly less optimistic. To understand it properly, it is useful to take a broader perspective. Here we see that ETH during its recent declines has recorded levels reached in May/June last year. Although Bitcoin has already been in a similar situation recently, Ether’s downward momentum over the past week is much higher. Moreover the $1700 level has already appeared twice and in a rather short period of time. This is quite a worrying signal. It is confirmed by the rather low volume, the difficulty with which ETH tries to hold the 20-day SMA, and the bearish RSI divergence. Further declines could end up testing the 2018 peak at $1420. The short-term limit of possible increases is worth watching at the upper edge of the Bollinger Bands.
Altcoins follow in the footsteps of Ethereum
Although with the rise in value of BTC, many altcoins have also rebounded. Their capitalization chart(Total3) traces the behavior of ETH. We can clearly see exactly the same aspects we outlined in the paragraph above – a decline to the historically important area of $395 billion and its retest in the following days. There were also weakening chances of holding the 20-day SMA, and a clear bearish RSI divergence. Declines could steer altcoins towards the $300 billion level. Rises on the other hand are a chance to hit the 600 billion level.
Is it bullish or bearish time?
The obvious question in the current situation is whether this is already a chance for a bullish rally or whether the bears will still remain the dominant force. The recovery in the stock market has brought optimism to the cryptocurrency world. However, looking through the calendar and historical data, we can see that the beginning of holiday periods (which we are entering now) are usually periods of declines or possible consolidations. It is worth being cautious in such circumstances.

