A less than ideal close to the week results in a bloody market opening on Monday. Bitcoin is looking for a local bottom of its valuation. Let’s check where it might be located.
The 20-week EMA has not been reached
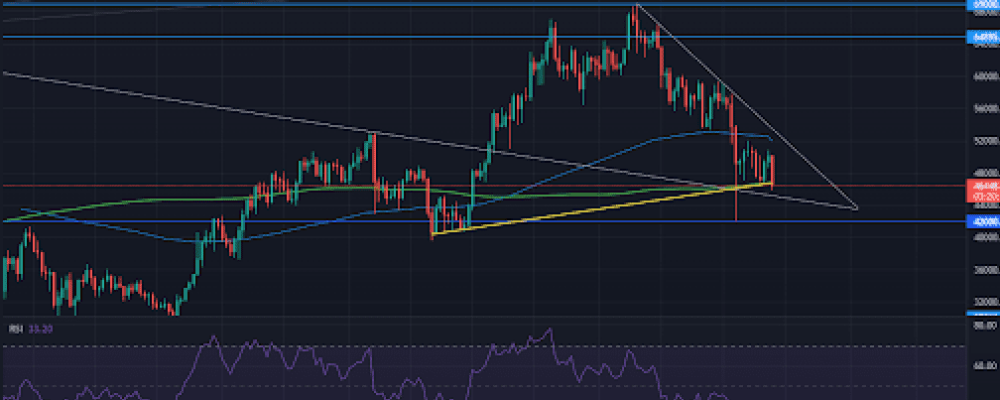
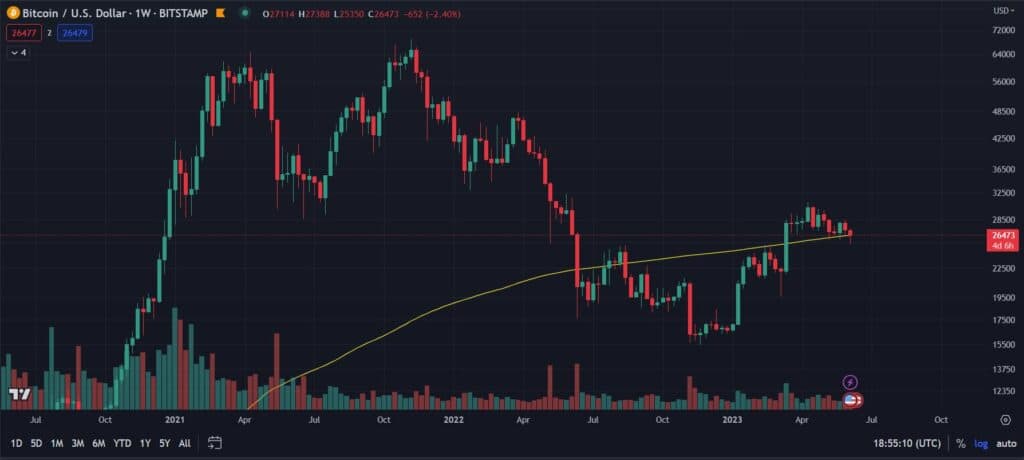
The main role on the Bitcoin chart is played by two independent moving averages. We discussed them in the past week. One of them is the 200-day SMA (green line), which so far plays a key support for the price. On the other hand, the 20-week EMA (blue line) has become a strong resistance. The key to the return to stable growth was the effective upward breakout of the latter before Sunday’s session close. However, this did not happen, resulting in a bloody Monday in which Bitcoin, at its peak, fell as much as 8.7%.
The 20-week EMA is important because it was a support for the BTC price during the 2017 bull market. Many investors have been watching it closely, thinking that closing two weeks in a row under the mentioned average is a signal that heralds a bear market. Nevertheless, going below its area and staying there for a longer period of time has already taken place this year. Despite this, a few months later Bitcoin managed to climb again to the new ATH. Is it therefore losing its significance? It is very possible!
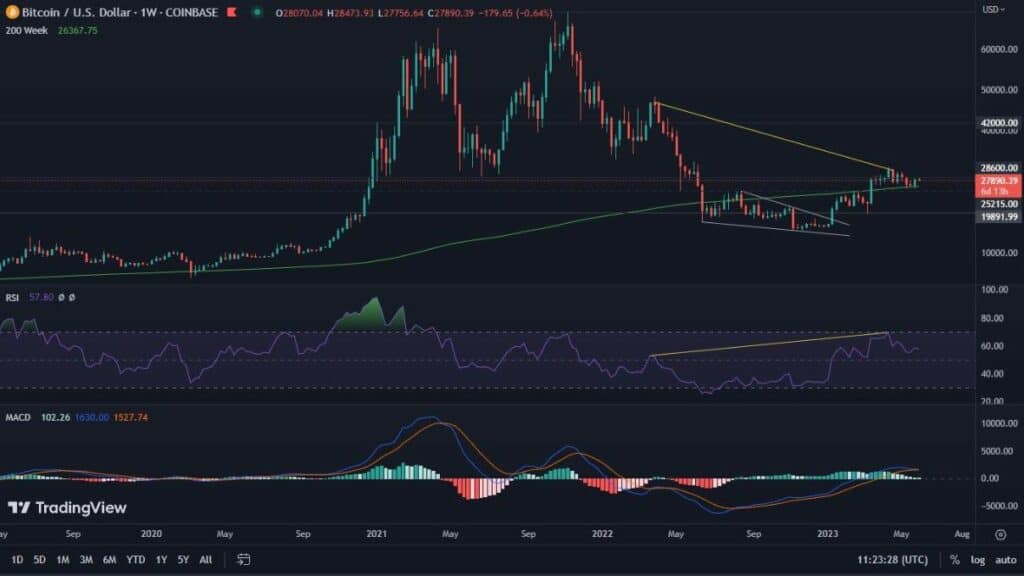
Meanwhile, we are seeing a renewed struggle to hold the 200-day moving average. What is important, the dynamic price movements still take place in the previously determined formation, where the lower part of the pennant constitutes support. Its breakout could still bring the Bitcoin price to the $42.00 level.
What supports the positive rhetoric is undoubtedly the hidden bullish RSI divergence (highlighted in yellow). We have seen two such divergences in the current year and both have played out with increases knocking out new highs. Support points are therefore abundant. Resistance, on the other hand, can be the aforementioned 20-digit EMA and the upper limit of the pennant. Their breakout is crucial in the context of further increases.
Ether breaks down an important level
The second most popular cryptocurrency fails to maintain the support marked by the green line. Thus, it is heading towards the white line of the downtrend, where it temporarily stops. This is also the 0.382 Fibo level. Its breakout may lead ETH to 0.5 Fibo located at the USD 3300 price level. The possible upward movement has the right to change the essence of the previously mentioned green line of the upward trend – from support, into resistance.
Total market capitalization before the turning point?
Looking for a bottom for the cryptocurrency market, it is worth paying attention to the chart of its total market capitalization. Here, too, we can notice several interesting points.
First of all, we can see the white line drawn earlier, which is resistance. The market again respecting it successively weakened. It is also worth noting the 200-day moving average. It has been a support for the valuation several times already, and as a result, the valuation is successfully bouncing off it. The Fibonacci retracements indicate that the market is currently supported at the 0.5 Fibo level of USD 2.07 trillion. It is still possible to go lower and thus form a double bottom. The 0.618 level coincides with the previously reached support and valuation of $1.85 trillion. Just like on the Bitcoin chart, here too we observe a hidden bullish divergence. Its playing out has the power to reverse the current downtrend.

