The drama that is unfolding at the FTX exchange is causing Bitcoin and many altcoins to reach a new bottom. Is this the end of the declines, or will we see BTC at $14,000 like many analysts say?
Market under pressure
The current situation is becoming almost twinned with the now famous Terra Luna collapse. This thread was the leitmotif of the market collapse back in the first half of the current year. Today, the collapse of the FTT token, resulting from a series of irregularities, is leading to further turmoil. Not only FTT suffers, but also Solana, which was a huge reserve of the FTX exchange, as well as the rest of the market. The result was that Bitcoin reached a new low for this year. Many altcoins followed the same pattern. And all this after short-term increases that led to a significant improvement in investor sentiment. It can be said that the current situation is a real rollercoaster, with many analysts suggesting a further collapse of Bitcoin until it reaches the $14,000 level. Let’s see if there are chances of that happening.
Bitcoin on the weekly chart
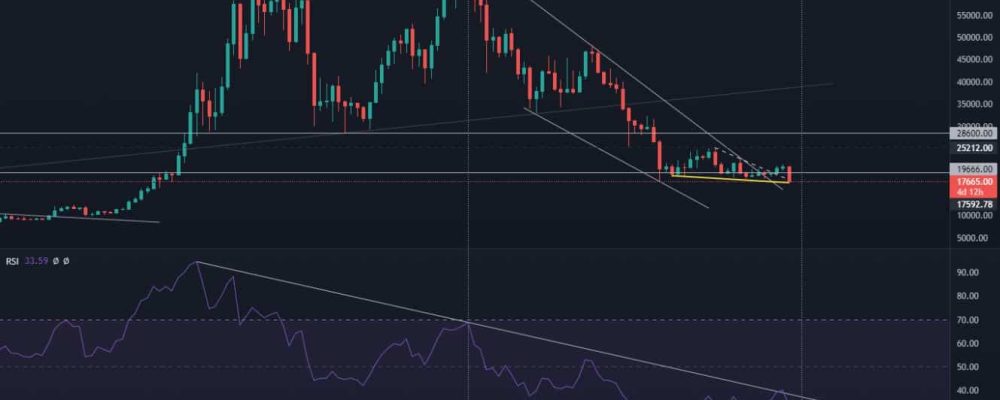
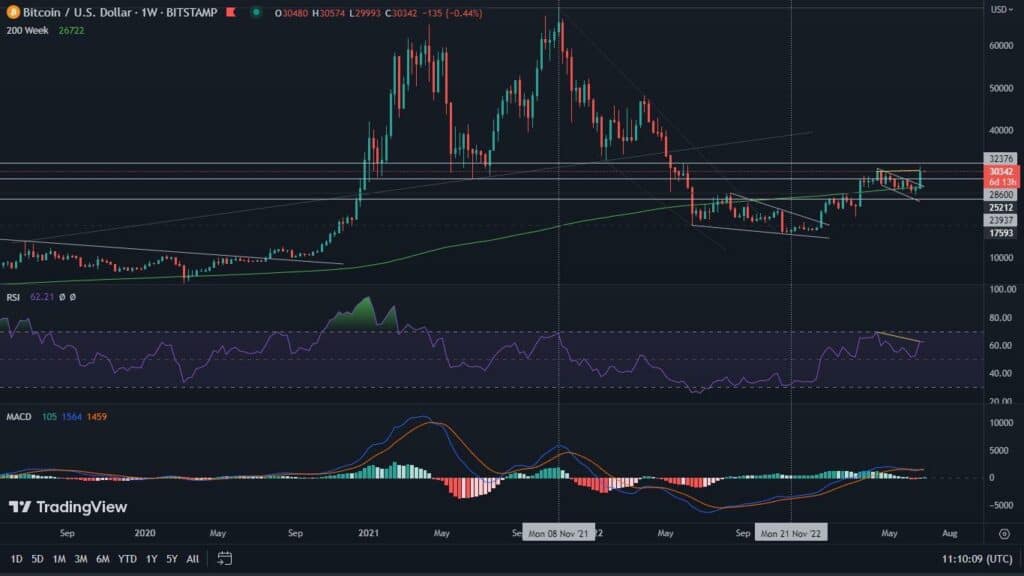
Here a very important thing happened. Well, the past week ended for Bitcoin with a breakout above the RSI downtrend line. Importantly, below this line BTC had been for a bagatelle 94 weeks. We reported on this fact on our Twitter profile. If you are not already following us, we encourage you to do so. You’ll then be up to date on the most important news.
Unfortunately, the breakdown has led to a renewed descent below earlier resistance. It is necessary to wait until the close of the current week and make sure that this situation is maintained. The same is also required by the forming bullish RSI divergence, which indicates a potential trend reversal. It may also appear that the chart is trying to emerge a bullish prop, although more time will be required to assess this.
Bitcoin on the daily chart
Meanwhile, on the daily chart, we have a clear bullish divergence already confirmed. However, this does not change the fact that the price can still go lower. However, this is a signal that, appearing in two relevant and independent time intervals, has the right to give the market strength.
It is worth noting at the same time that on the daily chart the potential pennant seems to be even more pronounced. However, we will wait until next week to outline it. The current sell-off has strong signs of panic. Its calming down is key to indicating rational scenarios.
Let’s also remember that already on Thursday, November 10, data on the current level of inflation in the United States will be revealed. Bitcoin at the currently quoted low levels, even after the FTX-related situation calms down, may be subject to high volatility. Thus, the value of the index has the right to determine which way the next movements will take place.
Bitcoin at unchanged levels of dominance
It is interesting to note, however, that in the meantime Bitcoin is still holding the vicinity of 40% dominance. Such significant declines in the valuation of cryptocurrencies usually resulted in the strengthening of BTC’s position. The absence of such a phenomenon in the current period, may be due to the flow of capital taking place from volatile altcoins, to stablecoins. Meanwhile, the chart with a weekly interval, shows no significant divergence.

