The Bitcoin 2022 conference that took place in Miami became an event used on the market, to buy rumors and sell the news. None of the news announced was strong enough to reverse the declines initiated during it. What’s next for the market?
Bullish Formations
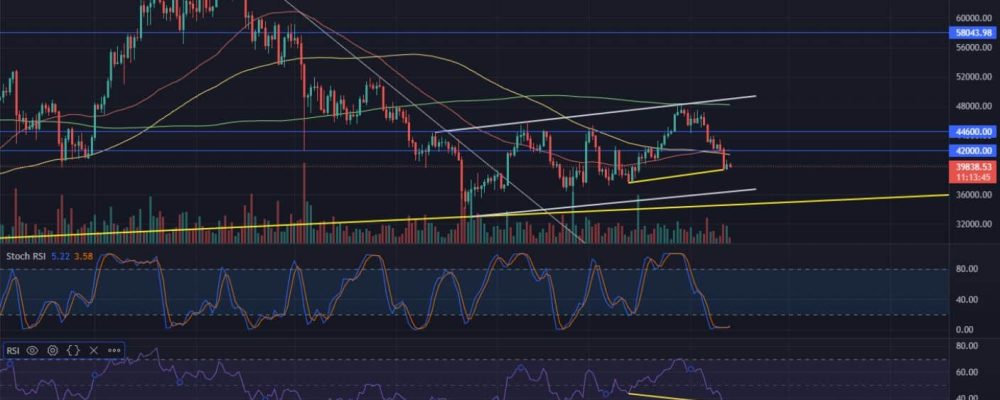
Looking at the Bitcoin chart we can see that any bullish formations formed in the last week have been canceled by the current downward movement. The price returned to the inside of the previously drawn symmetrical triangle and left it at the bottom. In its place, the ascending channel expected by us in the previous analyses was formed.
Of course, this formation is bearish, but there are some indications of potential upcoming increases. First of all, we observe a golden cross between the 50-day and 100-day SMAs. The stochastic RSI going down to zero and staying in this area has been suggesting extreme oversoldness in Bitcoin for several days. At the same time, we observe a divergence on the RSI. We can therefore expect an attempt by the bulls to come to the fore. Their goal should be an attempt to regain the levels of USD 42,000 and later USD 44,600. Possible declines are the way to the lower border of the channel, which at the moment is located near 36,500 USD.
Ethereum as a copy of Bitcoin
Looking at the indicators on the Ethereum chart, we see an almost identical scenario to the one that is playing out on the Bitcoin chart. We observe a golden cross between the 50-day and 100-day moving averages, an extreme sell-off on the Stochastic RSI, and a divergence on the Classic RSI. The important difference between the two coins is that Ethereum has not denied the formation it broke out of. It is still above the symmetrical triangle, in addition, being at the level of $3,000 it tests the exact area of the breakout. In the most optimistic scenario, the triangle border may not be tested as support, which has the right to trigger an attack on $3,500 from here. However, in the event that ETH does not show such early upward strength, we can expect a descent to the $2,775 level and an attempt to rebound just from this area.
Total market capitalization with the same scenario
Another very important chart and another outright same scenario. The total market capitalization of the cryptocurrency market is experiencing the same anomalies that we see on the Bitcoin and Ethereum charts. Thus, we see a divergence on the RSI and additionally a very clear divergence is formed on the MACD. It is interesting to note how strong resistance has become the 200-day SMA. For nine days the market value rubbed against it, unable to break through it successfully. Market capitalization therefore returned to the level from which it broke out of the previously formed descending channel. The objectives seem quite clear. The bullish scenario is a renewed attack on the 200-day SMA. The bearish one is a retest of the channel itself, which is currently at the $1.45 trillion level.
Altcoin capitalization
Similar to the total market capitalization, we are seeing price action outside the descending channel on the altcoin capitalization chart (including Ethereum). We see an attempt to retest the 0.618 Fibo level and a bullish RSI divergence following it. The TD Sequential indicator, signaling the 9th negative candle, suggests readiness for upside. If they are played out, we can expect an attack on the 200-day SMA and the previously rejected 0.382 Fibo level. Possible declines are the way to 0.786 Fibo and thus the possibility of forming a triple day.

