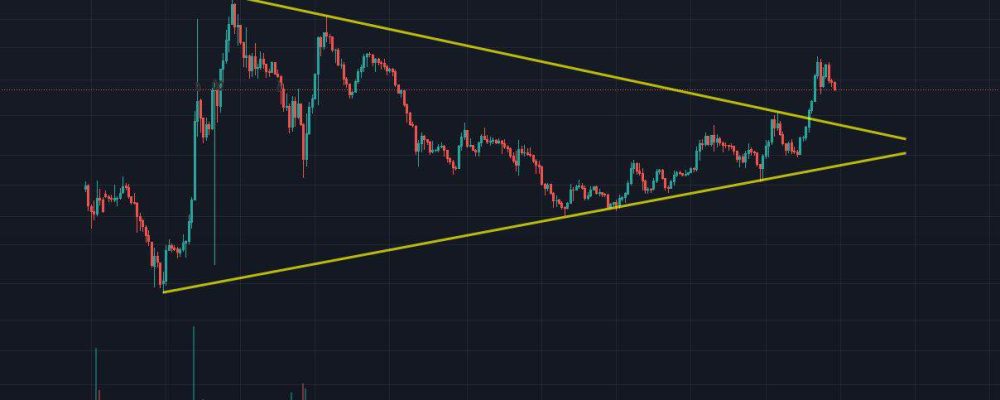
When looking for the right investment moments in crypto projects, it’s a good idea to use detailed analysis. In addition to an in-depth look at the fundamentals, technical analysis can be helpful. In this article, we will introduce you to the 7 most popular formations observed on charts and describe what potential movement they entail.
Head and Shoulders Formation
This pattern is not only popular, but also in most cases predicts the next move, which is a reversal of the uptrend. When a head and shoulders pattern forms, there are three price breakouts on the chart. The two outer ones are lower (shoulders – points 1 and 3) and the middle one is higher (head – point 2). It is worth noting that during the formation of the second arm, the volume profile (below the pattern) should be lower than in the case of the first arm, which confirms the observed pattern. By combining the lowest price levels reached by the forming pattern we will form a neckline. If we measure the height of the head to the neckline and carry this distance to the tip of the right shoulder to the breakout point (W), we can determine the potential range of movement.
Inverted Head and Shoulders Formation
The action of this pattern is the same as the classic head and shoulders pattern, with some minor differences. First of all, it is a pattern that heralds a possible reversal of the downtrend. Both the shoulders and the head are directed downward on the chart. If we pay attention to the volume, it should be higher on the right shoulder than on the left one. Neck lines and potential price targets follow the same pattern.
Symmetrical Triangle
It is a formation, which in most cases predicts the continuation of the already formed trend. It begins with a correction of a chart movement, which then meets resistance/support along the way, creating another price rebound in the opposite direction. This bounce, however, does not reach the value that started the formation, which results in lower volatility. There may be several such bounces, and the combination of their tops results in a triangle. In classic cases, the pattern should breakout between 25% and 50% from the top (W). It often happens, however, that the breakout occurs at the very end of the pattern. A potential price target can also be measured here. This is the height of the triangle measured at the second turning point of the price, measured from the exit of the triangle.
Uptrending Triangle
An uptriangle is a pattern in which the price peaks that are broken out are very close together. They allow us to draw a straight line. The lows, on the other hand, are increasingly higher. An ascending triangle usually suggests a price rise. The potential range can be measured in the same way as for a symmetrical triangle.
Descending Triangle
The pattern is almost perfectly opposite to that of an uptriangle. The price bottoms are at a very similar level, while the peaks are getting lower. A triangle is formed from the combination, which usually suggests a decrease in price. The potential range can be measured in the same way as for the previous triangles.
Rising Wedge
A rising wedge that is most likely to indicate a downtrend. In the simplest terms, it is an ascending triangle with a significantly drawn-out top above the low point. In this case, each higher price breakout within the pattern is higher than the low point and lower than the high point. The price bottoms formed inside the pattern are also increasingly higher. Theoretically it is possible to determine the range of potential price movement outside of the pattern, but the precision of such measurement is quite low. In case of a potential breakout (W), it is therefore important to look for previously observed support/resistance levels where the price movement can be based.
Downward Sloping Wedge
A pattern that most often heralds an uptrend. It is practically the opposite of a rising wedge. It is based on a descending triangle with a significant downward pull from the top. Each subsequent downward price breakout is lower than the previous one. Price tops that are broken out from within are also increasingly lower. As in the case of a rising wedge, look for previous support and resistance points at the breakout of the (W) formation.


