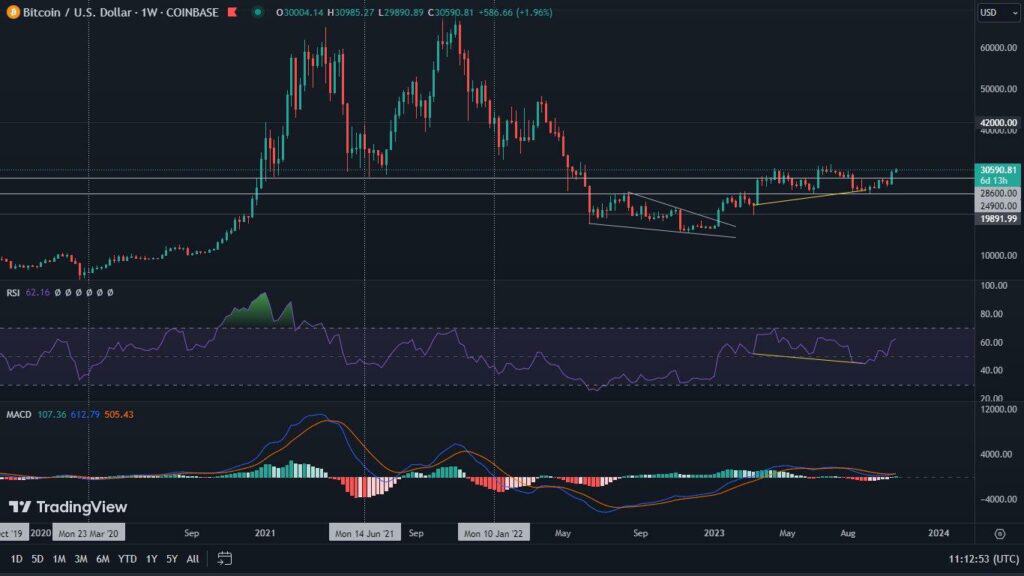
In recent days, Bitcoin has made a sharp breakout towards $28,600. There, however, resistance was encountered, which causes the leading cryptocurrency to head towards a key support again. Will it be maintained?
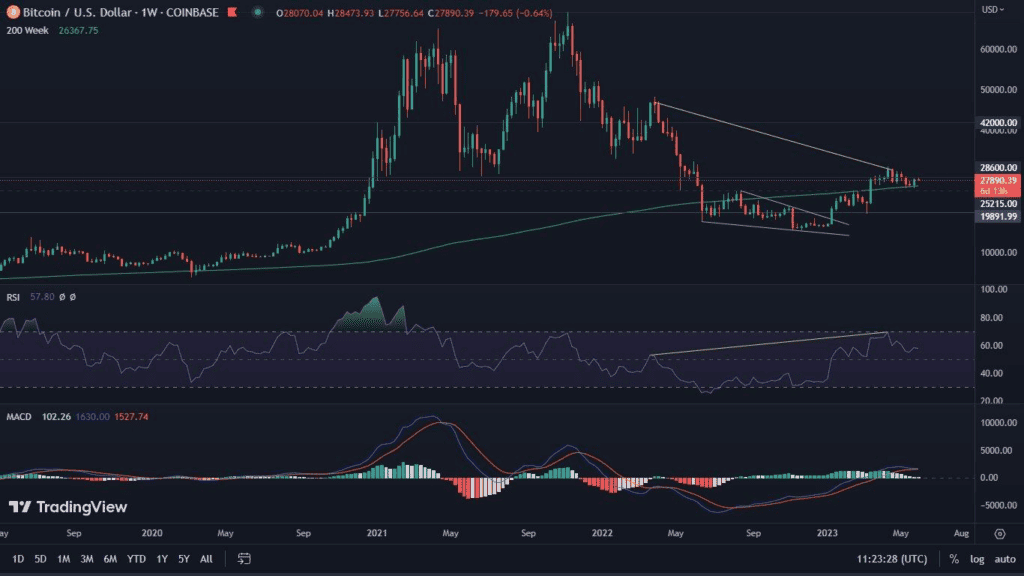
Bitcoin on the weekly chart
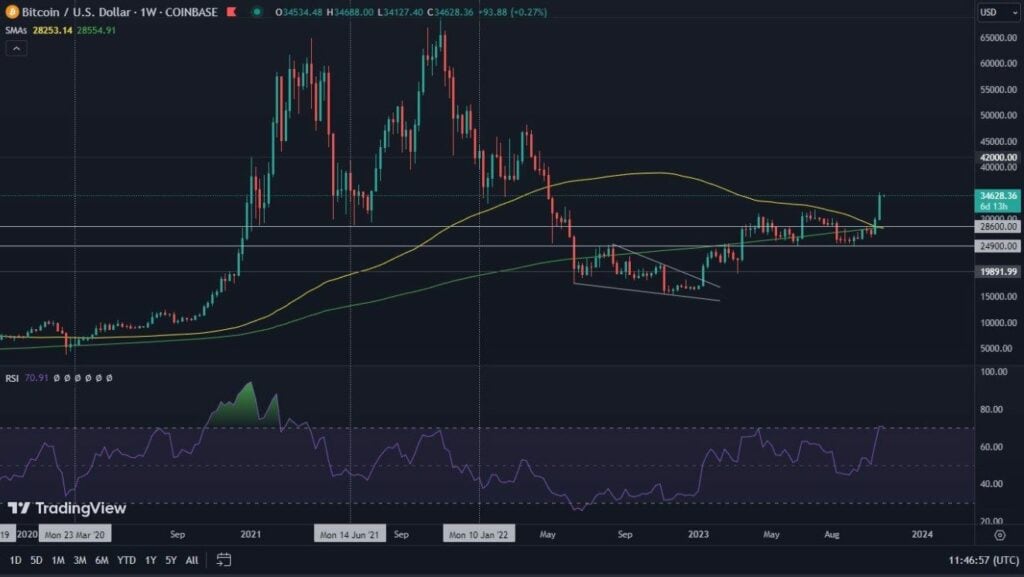
The past week ended with a sharp rise for Bitcoin. It amounted to exactly 4.9%. This movement caused the RSI value to rise above the level of 58. It is also clear that the all-important 200-week moving average was defended.
Despite this, we are still seeing a bearish RSI divergence, which still has the right to widen. This upward movement also did not change the trajectory of the MACD, which remains downward and which is heading towards a bearish cross.
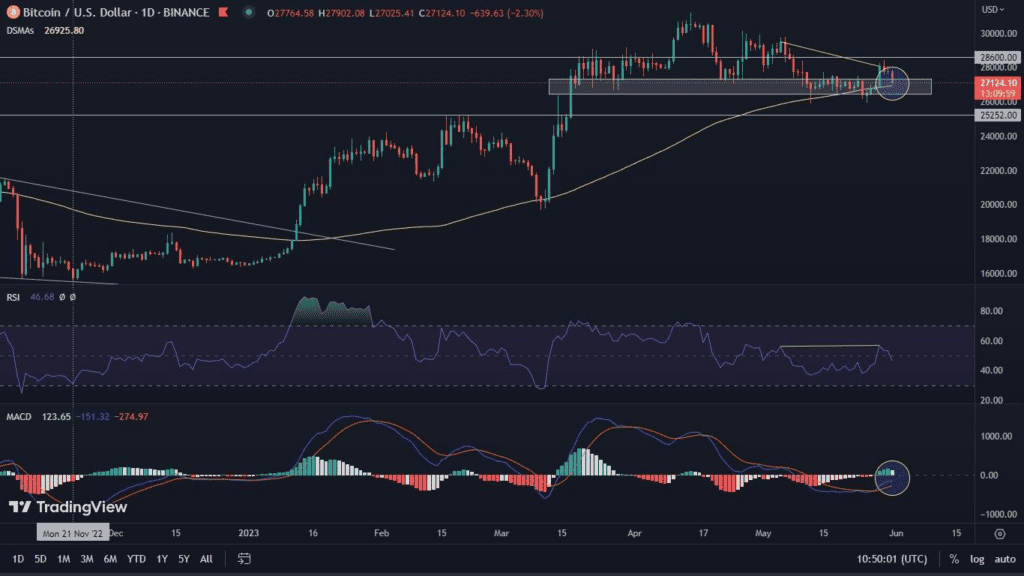
Bitcoin on the daily chart
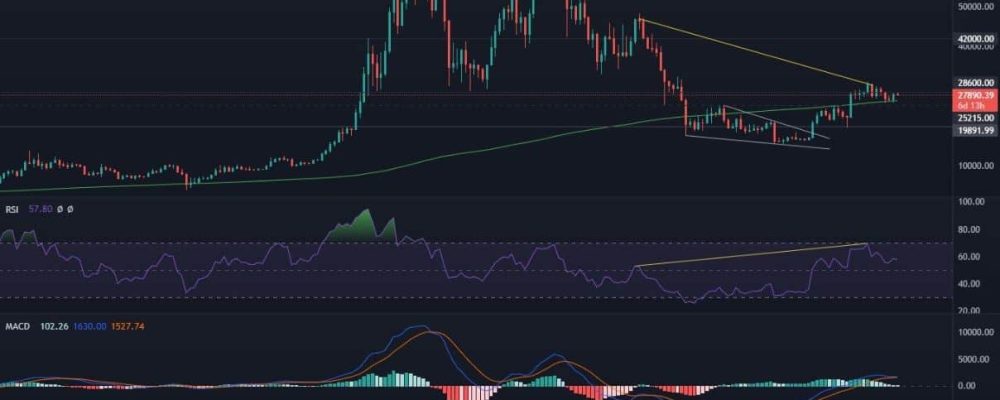
This is where most of the action is happening by far! The daily chart of Bitcoin shows a very clear battle between bears and bulls at the moment. The arguments in favor of the former are manifested in the RSI divergence, as well as the downward MACD. However, for the MACD to be confirmed as such, the ongoing day’s trading must end with a clear red candle.
In response to these facts, the bulls are turning to horizontal support, which Bitcoin has just reached. Its strength is increasing due to the 100-day moving average in the same space. Both of these aspects are capable of holding the price at higher levels and causing the bears to wipe out their selling power. However, if this does not happen, declines to the vicinity of $25,250 remain likely.
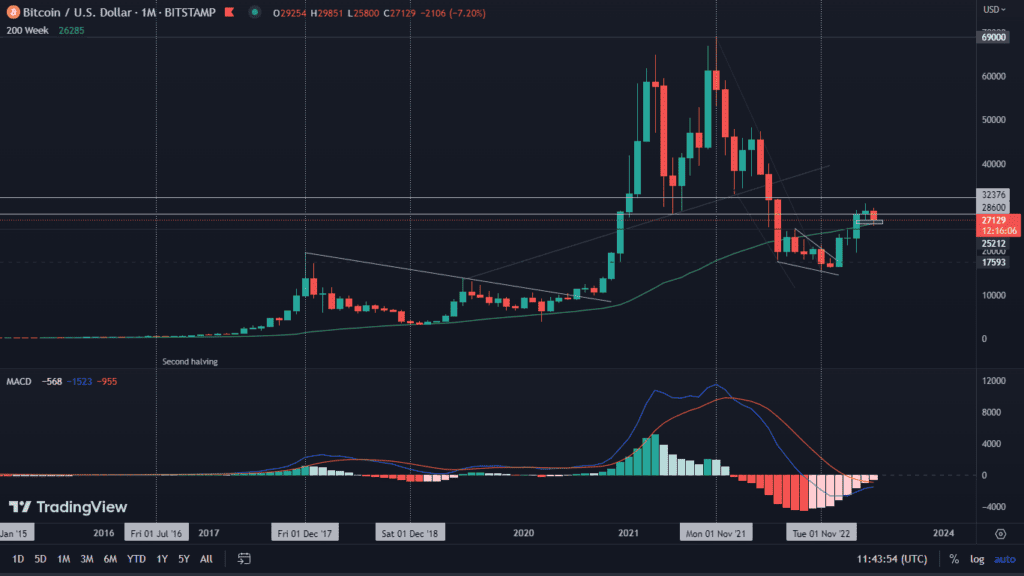
An important moment on Bitcoin’s monthly chart
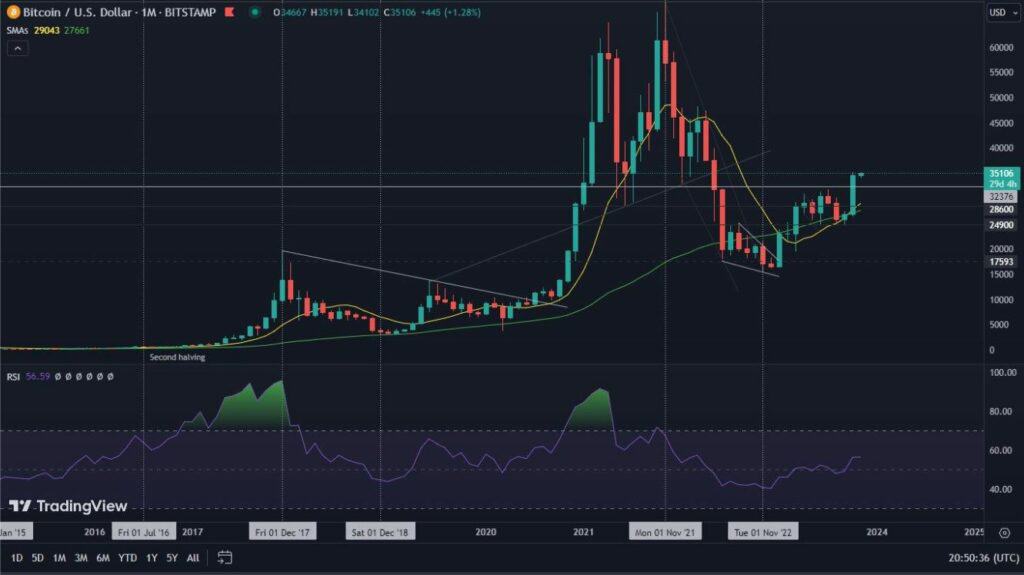
It is worth remembering that at the time of writing this analysis, Bitcoin is within a few hours of the month’s close. We will certainly discuss this fact in more detail next week. Nevertheless, it is already worth observing that there has been a clear rejection of the $30,000 level on the chart. This reaction seems perfectly natural and causes Bitcoin to seek support above $25,000, and at the same time, at the 200-week moving average. For the moment, these operations are proceeding successfully. The price action is supported by the MACD, which maintains a bullish momentum, as well as a very balanced structure. If June does not bring significant declines, the indicator will soon experience a clear bullish cross. This one has historically heralded periods of further increases.
Bitcoin’s dominance maintains the formation
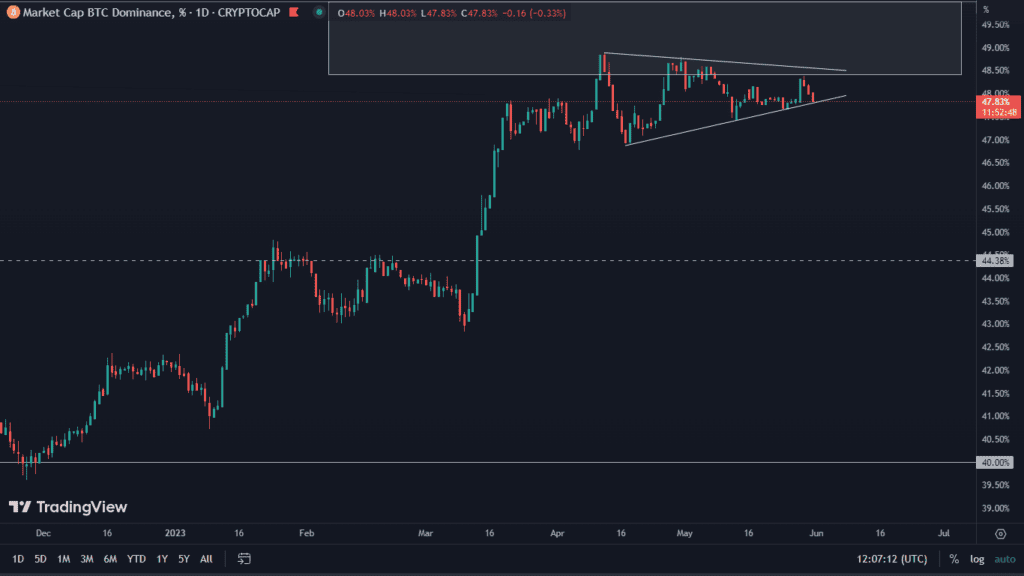
Despite the price turbulence experienced by Bitcoin, the chart of its dominance still remains intact. Recently, we drew attention to the symmetrical triangle forming on it. At the time of writing this analysis, its lower boundary is being tested. Formally, bitcoin itself is at high price levels that should push altcoins to rise. At the moment, however, this is not happening. A possible breakout of the triangle towards the bottom could positively affect smaller coins and cause them to shoot up. Nevertheless, the triangle formation argues for the continuation of the already established trend. Hence, an attempt by Bitcoin to attack the resistance located just below the 50% level is expected. We have marked it with a gray rectangle and strongly recommend its observation.
