Bitcoin has been experiencing overheating on a number of key indicators for quite some time. As a rule, this kind of behavior suggests a correction, here, and good buying opportunities are coming. Optimism related to the latter is justified by on-chain data.
Bitcoin on the weekly chart
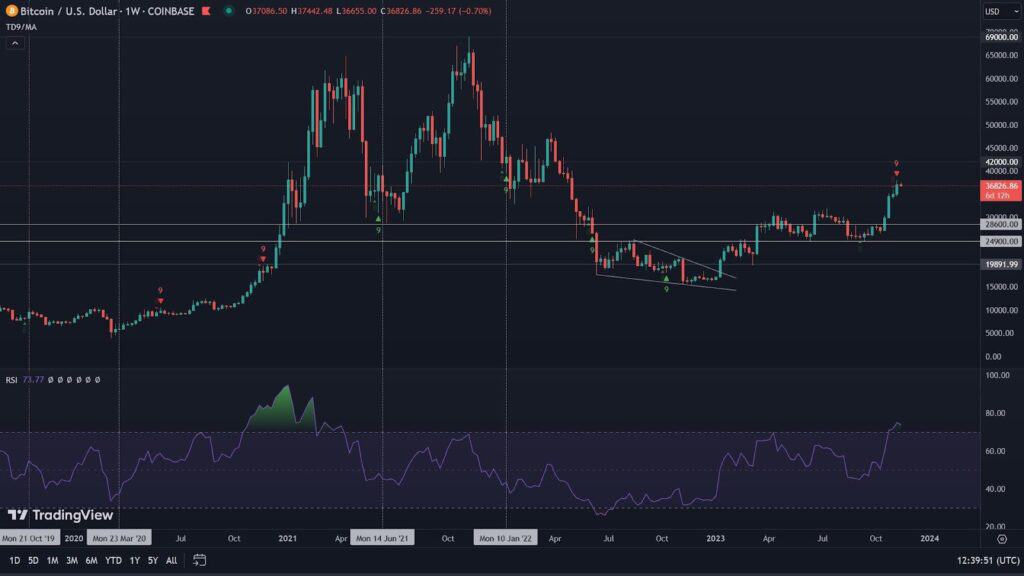
Looking at the results that Bitcoin is recording on the weekly chart, it can be assumed that the upward wave is steadily strengthening. Nevertheless, more and more indicators are beginning to show the need for a reset and thus a correction.
Thus, we observe that the price of BTC jumped another 5.85% in the analyzed period. The effect of this RSI managed to rise above the level of 74. These values are as healthy as possible, but they are accompanied by the warning signals mentioned earlier. The first of these is the ninth consecutive upward candle of the TD Sequential. As we know, this is an indicator whose purpose is to estimate the turning point for an ongoing trend. It is not infallible, of course. Therefore, it is worth looking for confirmations for this kind of scenario.
Here comes the Stochastic RSI, which, oscillating at very high values, shows a willingness to make a so-called bearish cross. The OBV also looks weakened. Here, in turn, we can see a bearish divergence. However, to this indicator, in the current situation, it is worth approaching with a little reserve, as the mentioned divergence looks relatively easy to negate.
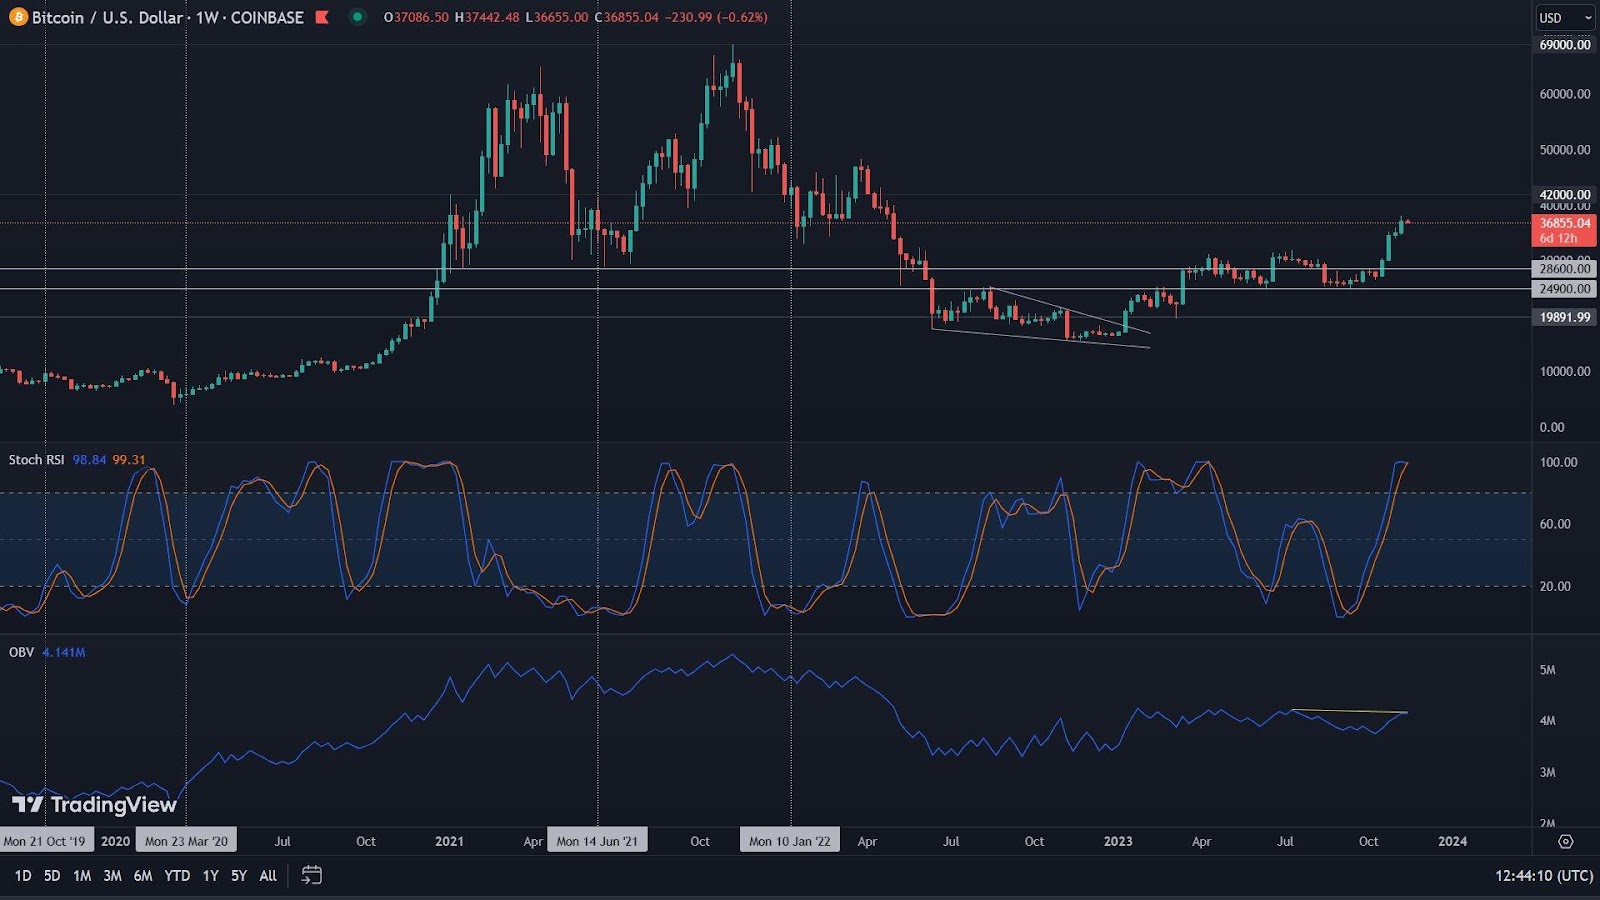
Looking for support on this time interval, it is worth looking in the direction of $32.300. Although the price of BTC may not necessarily fall that low, we expect the region there to be full of buying orders.
Bitcoin on the daily chart
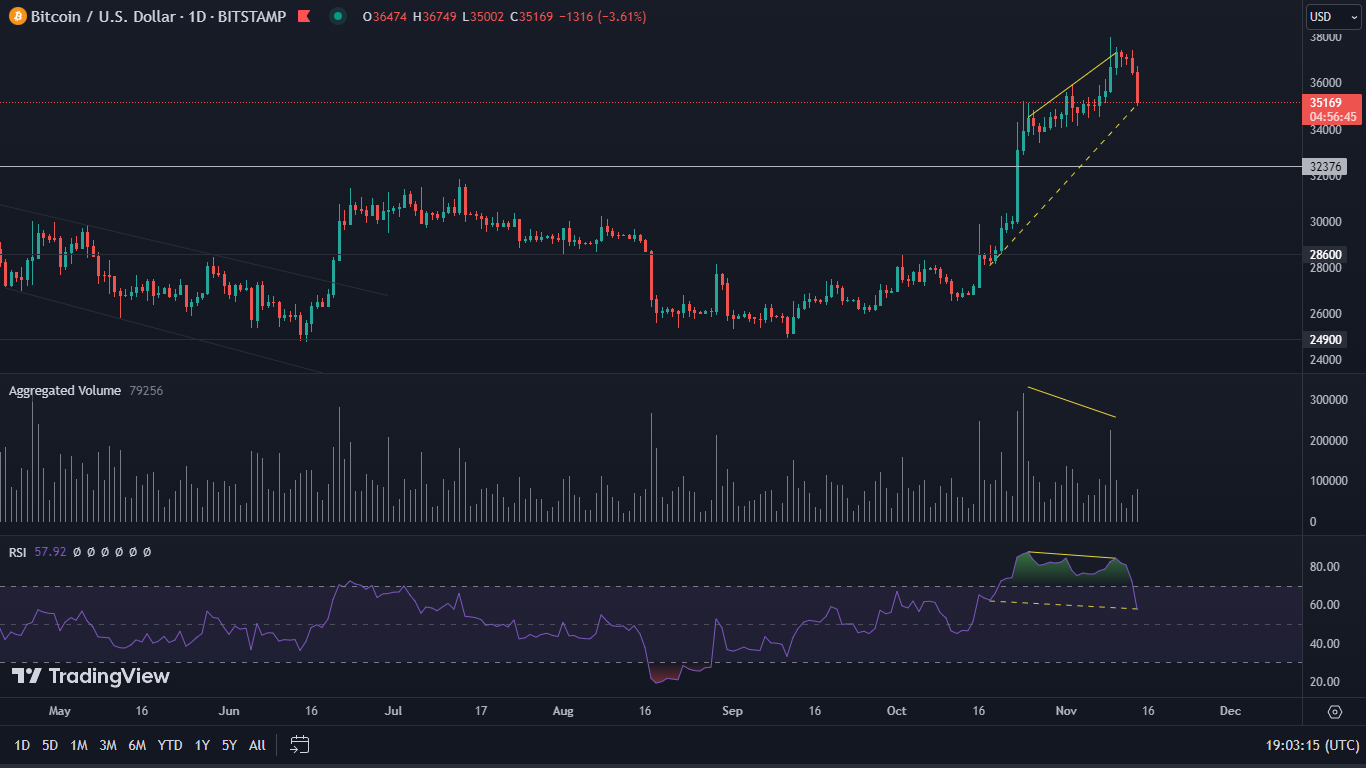
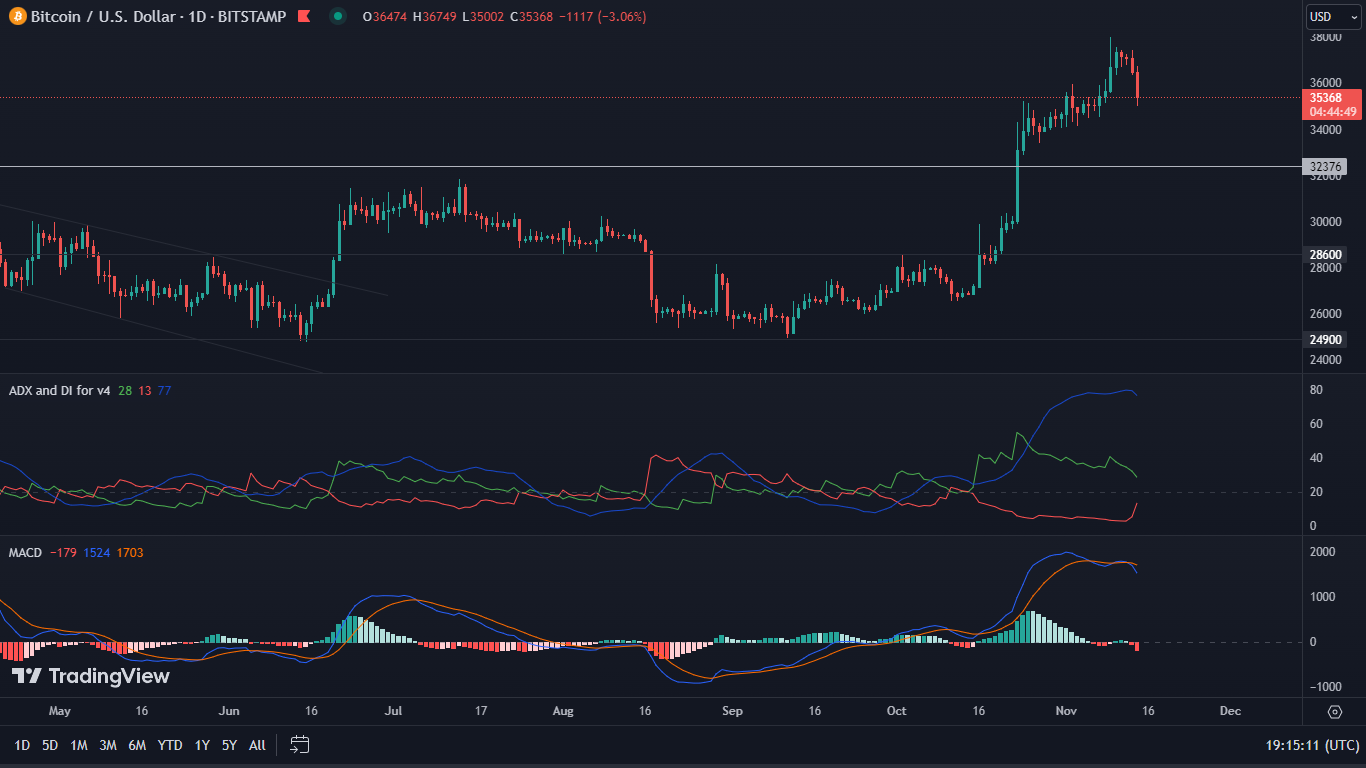
We can see many more warning signals when we look at Bitcoin’s situation on the one-day interval. Here the strong bearish divergence of the RSI, which we have marked with a yellow solid line, strikes our eye. However, it is worth noting that at the same time, a bullish divergence is also forming on the same indicator. This one, in turn, we have circled with a yellow dashed line. However, we do not expect a positive scenario to play out quickly. This positive divergence, even in the event of much deeper declines, will still remain in place. In addition to this, we also see volume, which, despite recent increases, has definitely lost strength.
To fully illustrate the situation in which Bitcoin has found itself, it is also worth looking in the direction of the ADX and MACD. Here we must admit that we are one of the very few portals that use ADX in technical analysis. This is surprising, since this indicator, like the TD Sequential, can quite accurately indicate turning points in ongoing trends.
Thus, ADX has reached the level of 80. This is a very high value, the achievement of which, as a rule, heralds a correction. The picture is completed by MACD, which has made a bearish cross and is currently in a downward trajectory.
Despite the negative short-term data, long-term optimism is emerging
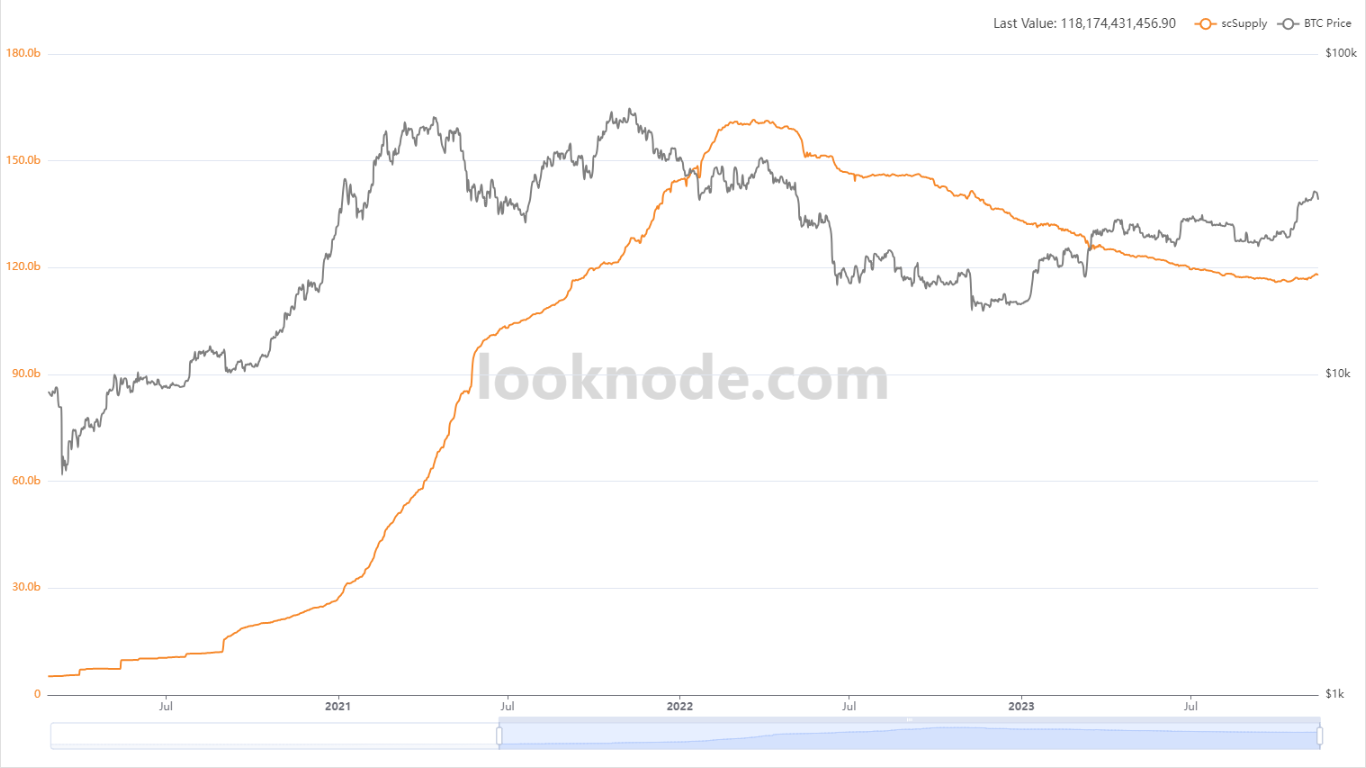
While the above technical analysis does not inspire optimism, it is worth turning to the on-chain data, which presents a very different picture. The chart we present below is provided by the Looknode.com platform. It talks about the number of stablecoins in circulation and takes into account the four largest coins, which are USDT, USDC, BUSD and DAI. We can clearly see on it that the circulating number of the mentioned stablecoins is clearly increasing. This is a very healthy signal, which in the long term has the right to positively affect the entire cryptocurrency market.