Bitcoin has lived to see tremendous volatility. After a dynamic downward movement, it came to even stronger increases. This resulted in the formation of a rare formation. There are many indications that the current price movements are the result of the banking crisis. For this reason, we have prepared a comprehensive analysis for you. Here we go!
Bitcoin on the weekly chart
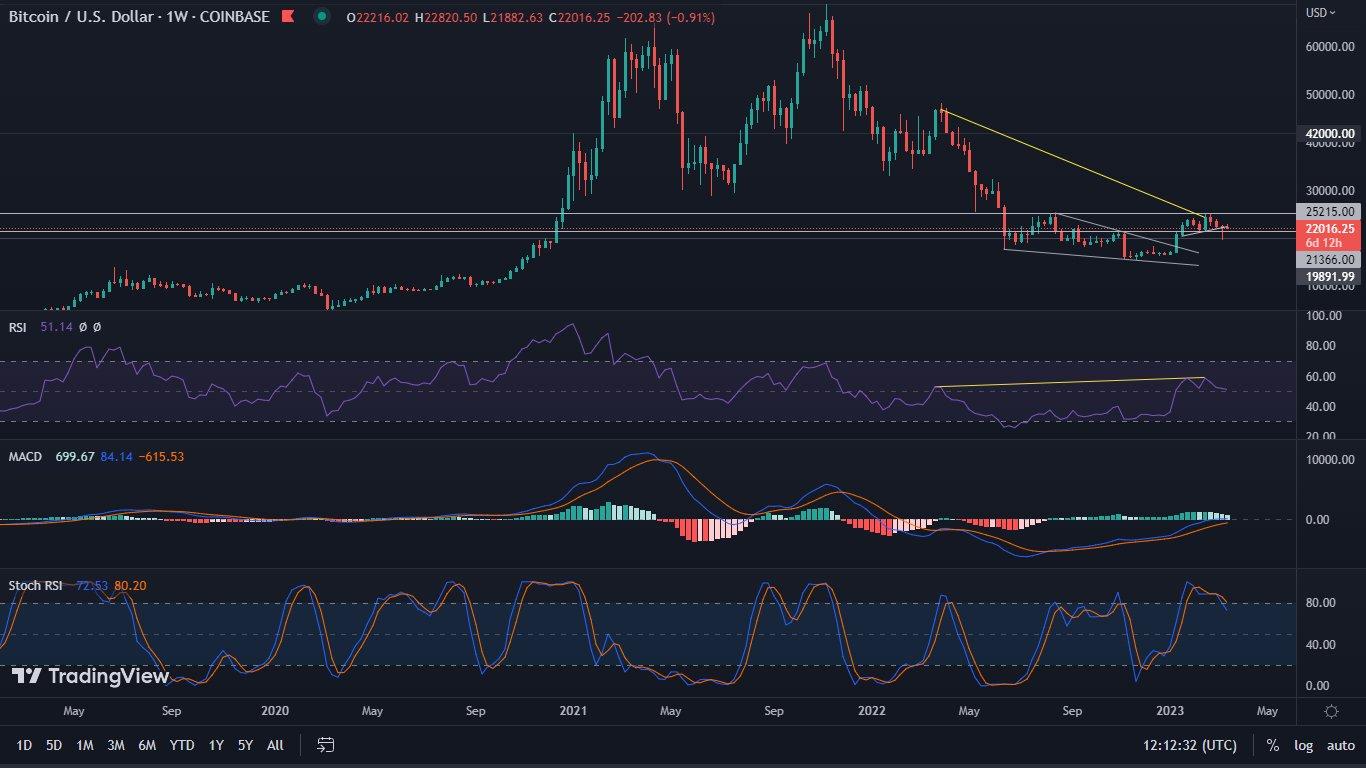
Bitcoin on the weekly chart showed the first signs of strength. Despite the declines that occurred just before the weekend, the price during the weekend managed to recover much of its losses. As a result, the weekly candle, although red, was barely -1%. While having a small body and a long wick, it became very strong. It suggested an upward movement. Nevertheless, the MACD continued to create bearish momentum, and the Stochastic RSI confirmed the bearish cross and attempted to leave the overbought zone.
On the other hand, a positive sign was the RSI, which continued to successfully select itself, maintaining its value above the 51 level. However, bearish divergence of the RSI should be kept in mind. As of the close of the week, however, it is unclear whether the observed declines were already a consequence of it, or whether it is, however, subject to further widening.
Bitcoin on the daily chart
And here is the real rollercoaster! After our last analysis, not only has the $21,500 level been overcome, but even the CME gap that was created a few weeks ago has been fully filled. We reported on its essence long ago, predicting that the price would sooner or later hover around it. Moreover, barely a moment later, despite falling below $20,000, Bitcoin began a dynamic upward movement. It triggered a new CME gap, located in the area between $20,085 and $21,455. As a result, the continuation of the dynamic breakout, resulted in a sharp breakout of resistance at the level of $25,200. This one, however, proved too strong to be sustained for the rest of the day.

Re-entering the price below the resistance, resulted in the formation of a megaphone formation. In principle, given that its movement originated at lower price ranges, in the medium to long term, it is a bullish formation. However, dips to areas around $22,500 and even to the newly formed CME gap are not excluded. In these areas, it is worth watching the behavior of individual indicators again.
Let’s remember, however, that the $25,200 zone was violated, and in a very strong way. Bitcoin has thus formed a new this year’s peak, at $26,533. This means that hitting the resistance again has the right to end with a successful breakthrough.
Banking crisis results in significant increase in Bitcoin holders
There is no doubt that the reasons for such dynamic price movements find their roots in the foundations of the king of cryptocurrencies. Often considered a speculative asset, it now has a chance to prove its true value. The collapses of Silicon Valley Bank, Signature Bank and Silvergate Bank, caused panic and a surge in customer deposits. Many, particularly U.S. banks, have suffered sharp declines in the value of their shares over the past week. The same is true of Credit Suisse, whose valuation, at the time of this writing, is falling below $2 per share, a historic low. Meanwhile, over the past weekend alone, the number of addresses with a minimum of 1 BTC in their account has increased by 3,14 thousand. The fact that Bitcoin is a scarce asset, and that modern tools allow it to be stored privately (without third parties) inspires great confidence in it.
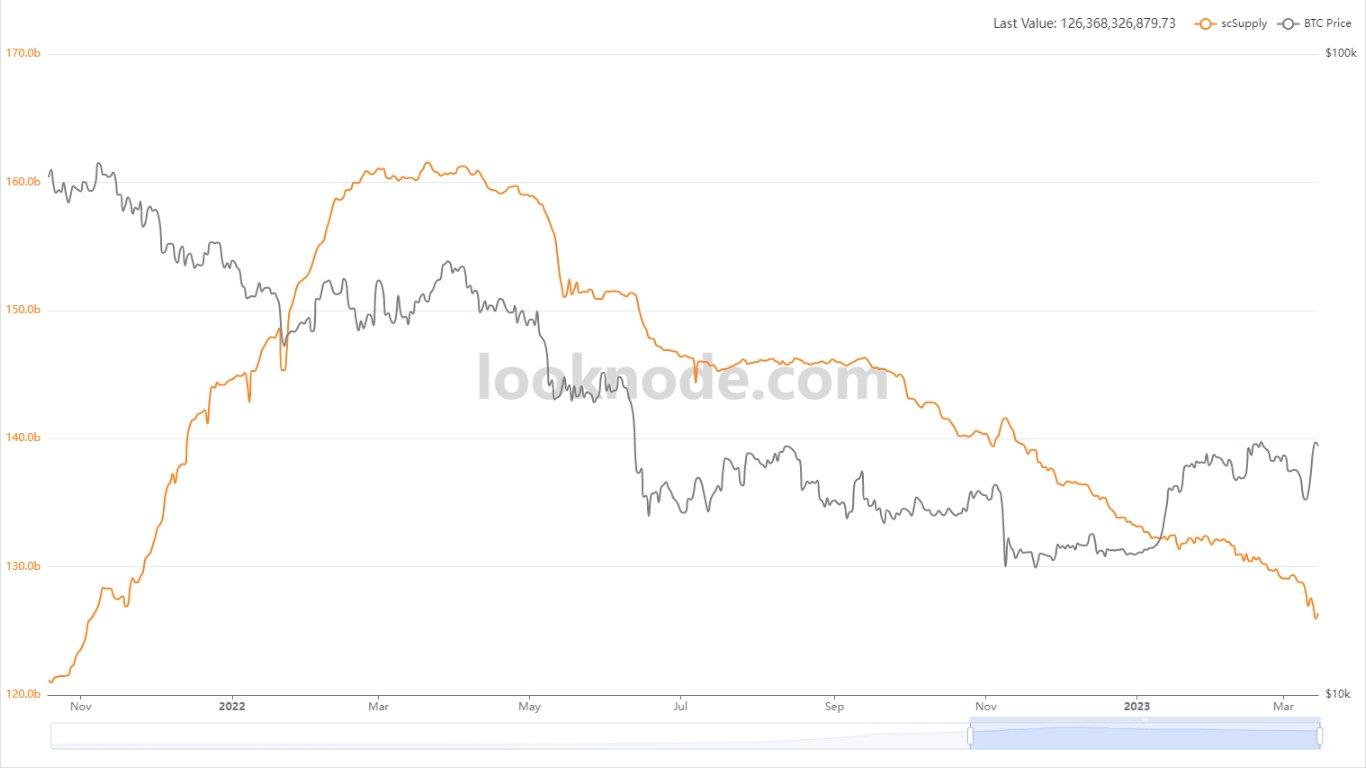
The following data was provided by the Looknode.com platform

One element continues to cause concern
Increases in the price of Bitcoin, have generally been accompanied by an increase in the number of stablecoins in circulation. Unfortunately, we still do not observe this fact. The result is that the circulating holdings of USDT, USDC, BUSD and DAI are steadily falling, while the price of BTC is rising. This divergence, which we have been paying attention to for a long time, has still not improved. This may indicate a potential correction.