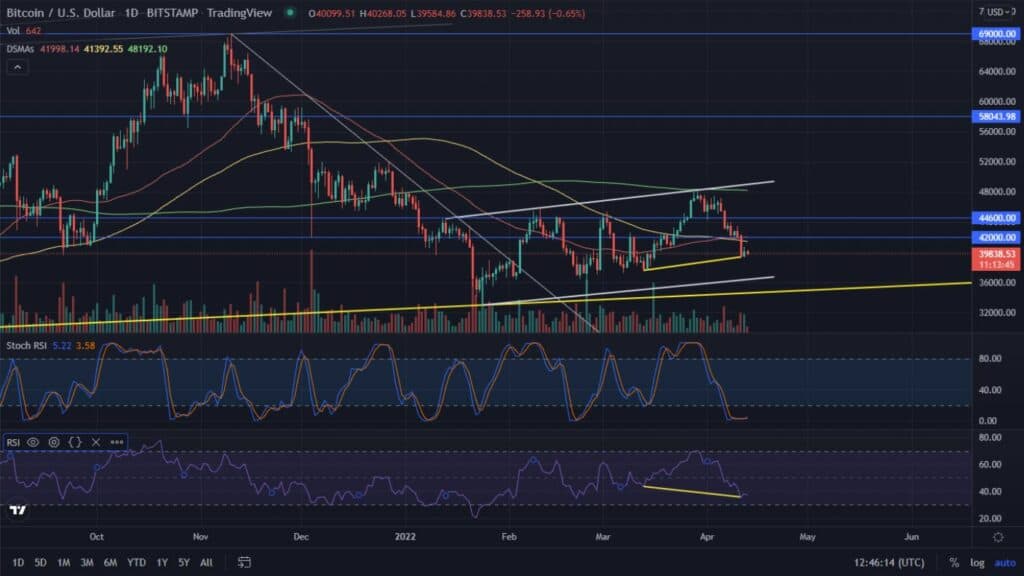
Bitcoin failed to hold support above $42,000 and in the process lost its 50-day moving average. What’s next for the leading cryptocurrency?
Signals appear to be getting more negative
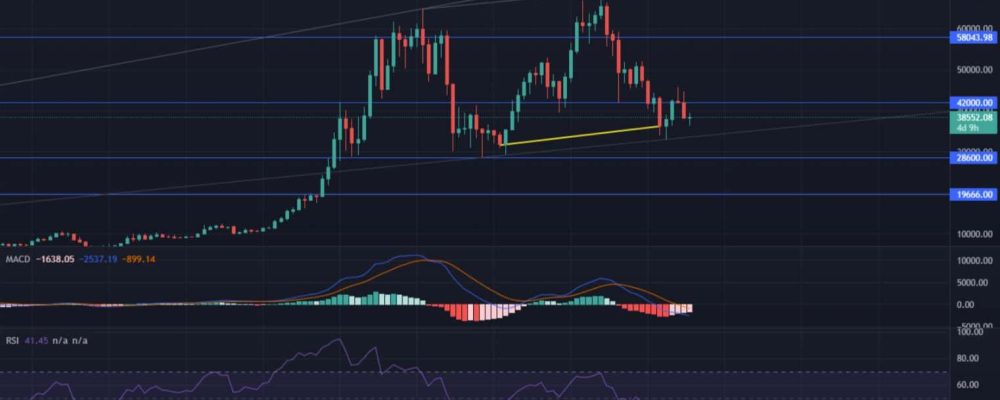
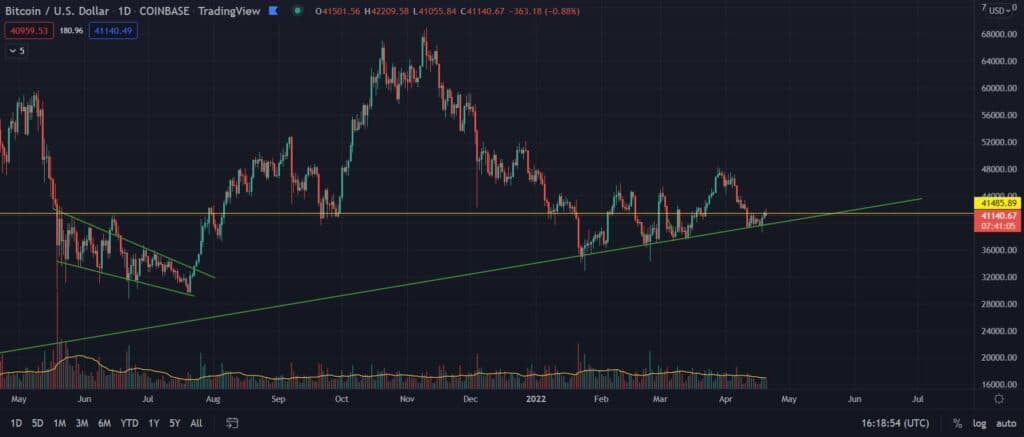
In the previous analysis, we pointed out the bearish divergence appearing in Bitcoin’s price action. It turned out to be strong enough to cause BTC to fall below key supports. We are of course talking about the price area between $40,000 and $42,000. Also significant is the loss of the 50-day moving average (green line). These signals triggered the bears, which led to pullbacks, reaching the value of $36,370. In this area we observe the Bollinger Bands boundary, which protected BTC from further downward movement. However, looking at the RSI it seems that there is still room for further declines. The target may be to test the previous trend line as support.
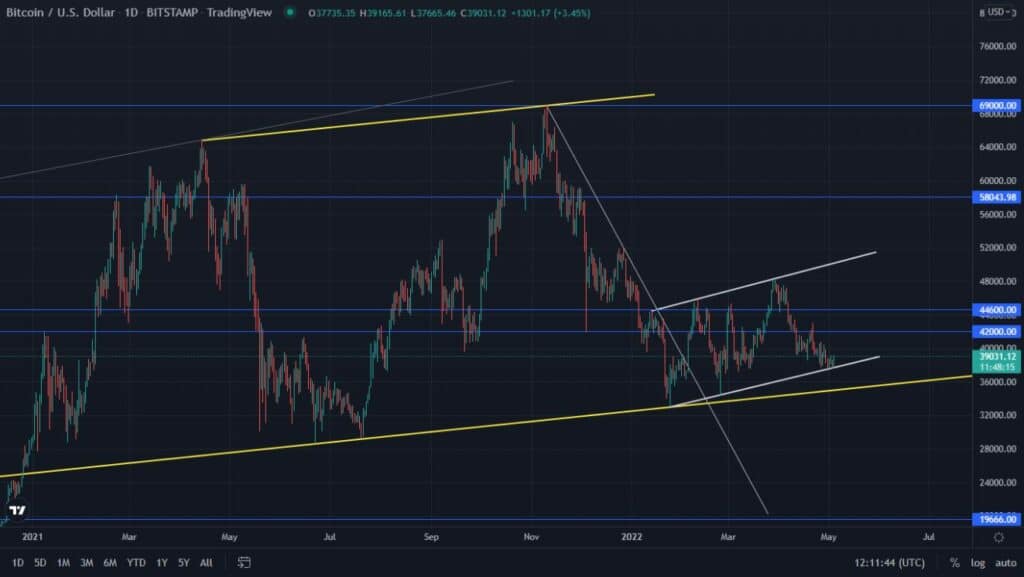
The behavior of Bitcoin in relation to the aforementioned Bollinger Bands may be a cause for concern. Price movements below the 20-day moving average, which is located inside the band often announce continuation of the trend. In such a situation, it is worth paying attention to the level of $33,000 and to the long-term upward trend line that we have determined (yellow color). We expect that it is there that the bulls may attempt to take the initiative. However before that happens it is possible to test the 50-day moving average as resistance again. This is now located between $40,000 and $42,000 and that could strengthen the selling pressure. A return to the path of an uptrend requires overcoming the mentioned resistances, confirmed by higher volumes than currently observed.
It is worth to look at the chart zoomed out
The weekly chart gives strongly contradictory signals. We observe that the past two weeks have closed in the red. In addition, the way the candles closed suggests a potential deepening of this move. The RSI is bullish, suggesting an upward move through divergence. The MACD also looks quite good. We observe a slow reversal of the strength of the movement.
Ethereum at the decision point for a long time
Ether follows Bitcoin’s price action and reacts to the Bollinger Bands just like it. It is, in effect, at the bottom of the area defined by them. It has twice struggled to break out of the 50-day moving average (green line) and on both occasions, after crossing it, was unable to hold it. It will be interesting to see how ETH struggles to find support at the upper area of the previously broken descending channel. This could indicate significant market uncertainty. A strong breakout above the aforementioned 50 SMA could confirm the upside. Otherwise, a move even near the January low at $2,160 is not out of the question.
Total market capitalization continues to fall – altcoins bleeding
Looking at the total valuation of the cryptocurrency market, we see that it is in a descending channel. At the same time, the capitalization reacts to individual Fibonacci retracement levels. Here we also see a reaction to the 50-day moving average and two unsuccessful breakouts of it. If the market recovers, its valuation should attempt to break out of the channel. Otherwise, the 0.786 Fibo level, or even the bottom of the channel, will provide another support level.

