Bitcoin has been in a clear rally since the beginning of the year, having already gained 53.3% to date. Recent weeks, however, indicate a deceleration of the movement and consolidation. This one is taking place just below a key horizontal resistance, as well as the 200-week SMA.
Bitcoin on the weekly chart
The death cross we discussed a week ago did not affect BTC’s short-term price action, making the next seven days bring an 11.5% increase in the value of the leading cryptocurrency. This allowed the MACD indicator to once again capture bullish momentum. It was followed by the RSI, which managed to rise above the level of 58. In the meantime, however, we observe a bearish divergence of the RSI. We have already indicated that it could widen. This is also happening. Despite the momentum, Bitcoin bounces off the $25,200 level, and also closes below the 200-week moving average (pink line). As we can see, the confluence of both factors at one point, represents very strong resistance.
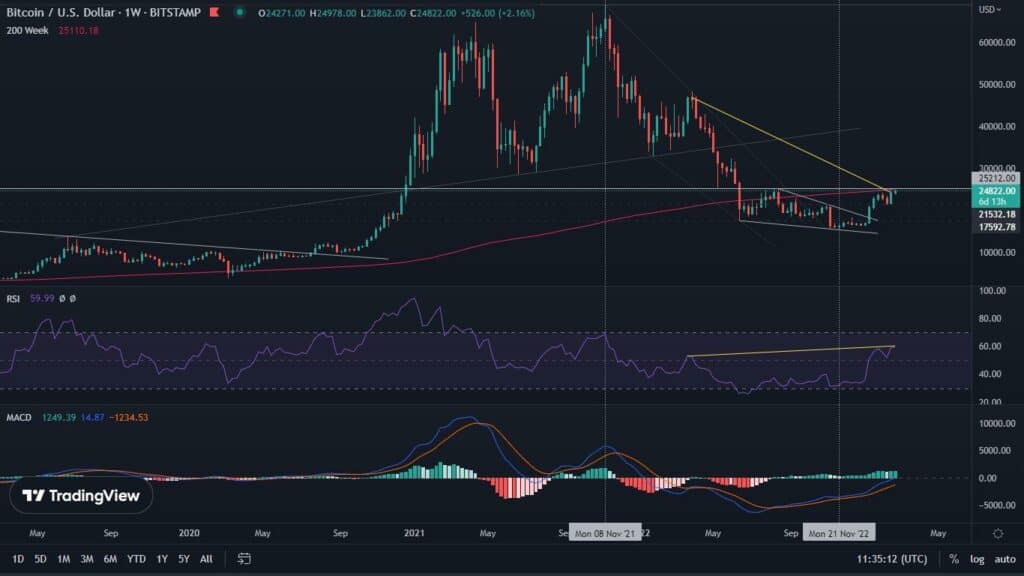
Meanwhile, the logarithmic chart is also interesting. On it, the long-term downward trend line has not only been overcome, but also confirmed as support. However, the fact that the rebound is accompanied by weakening volume may be cause for concern.
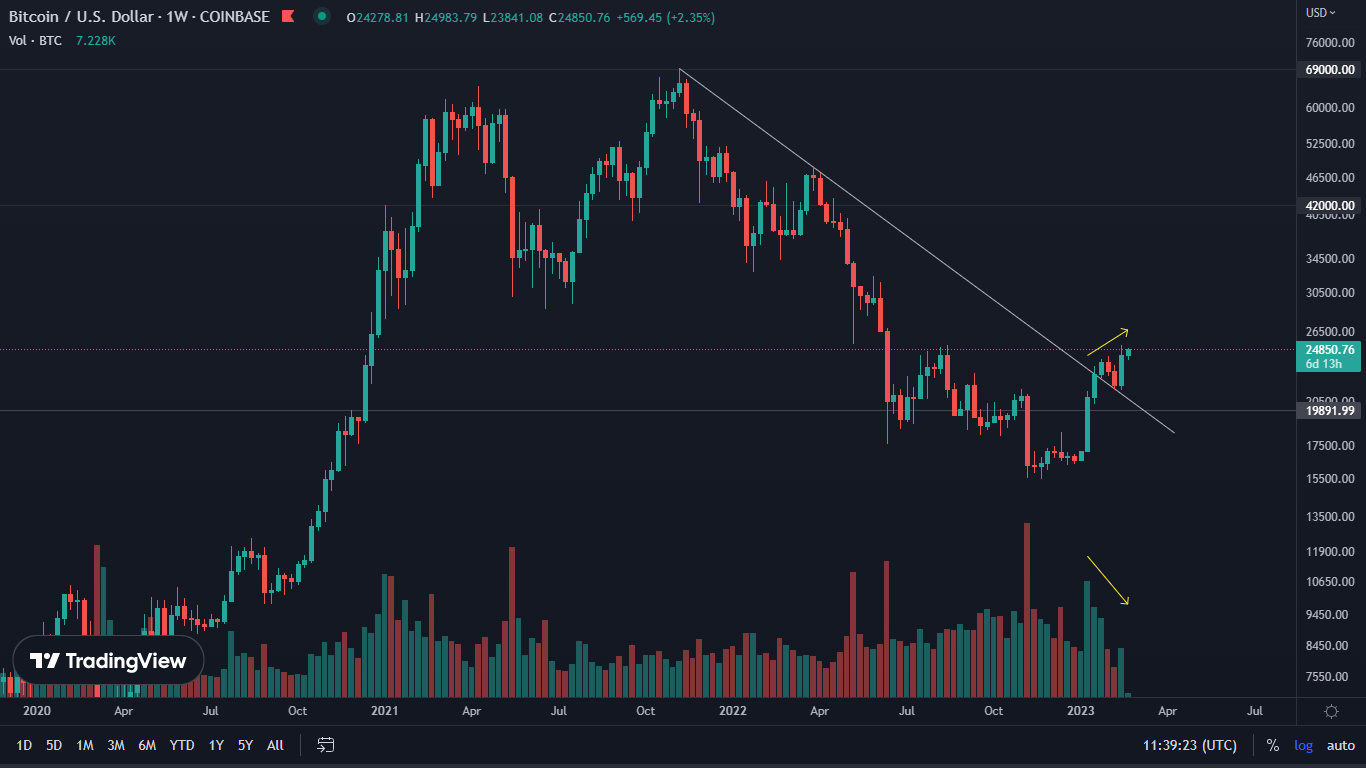
Bitcoin on the daily chart
While the weekly chart looks relatively interesting, the one-day chart does not inspire optimism. This is because it illustrates a number of warning signals. First of all, the price action itself indicates numerous rejections of the $25,200 level, which is historical resistance. In the same zone there is already the aforementioned 200-week SMA, which causes each successive candle to close under its area. However, that’s not all. Looking at both the RSI and OBV, we see very clear bearish divergences. When they appear in conjunction with local resistance, the probability of declines gains strength. If such occurs, we suggest watching the CME gap level. The invalidation of this scenario, on the other hand, will be the overcoming of resistance and its confirmation as support.

Stablecoins do not follow the market
Using the data presented by the Looknode analytics platform, we can look at the detailed on-chain data. It turns out that despite solid increases, there are some significant anomalies in the cryptocurrency market. An excellent reflection of these is the chart of the total amount of stablecoins currently in circulation. According to the data presented, while the price of BTC has increased by 53.3% since the beginning of the year, stablecoins are steadily declining. This is not something we want to see in terms of potential further increases.

Although the market still has a rich supply of stablecoins currently on the sidelines, it is not willing to buy through them. Meanwhile, new capital is not flowing in either.
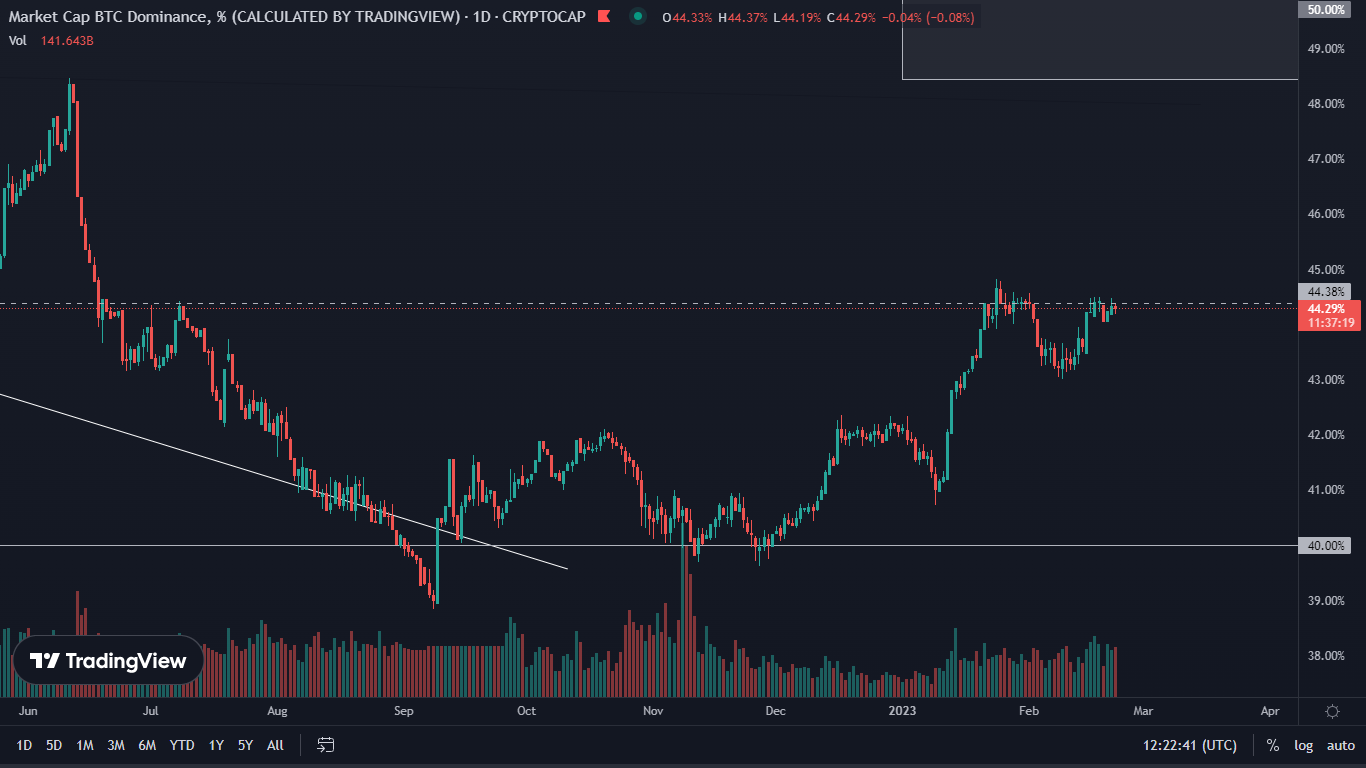
Bitcoin’s dominance pending another move?
A chart indicating a possible upcoming dynamic move, is the dominance of BTC. This one is at local resistance, marked by the dashed line. In the meantime, it forms an inverted head-and-shoulders pattern. When forming this type of formation, it is worth paying attention to the volume. In this case, it should be increasing. This is also happening, by which the formation is confirmed. Its playing out can result in an attack on the 47% level and beyond, up to the rectangle marked in the upper right corner.