In our latest article, we have highlighted the downtrend line that Bitcoin has successfully broken through. This time, the leading cryptocurrency has set a higher local top and a higher low, which could indicate the potential start of an uptrend. However, this is happening with some difficulty.
An ambiguous, yet quite optimistic situation
Higher tops and bottoms have always been positive signals. This time is no different. The recent events that took place during the US Super Bowl finale could only fuel the demand for cryptocurrencies. This, of course, supported the current chart construction. Recall that during the event there were ads broadcasted for millions of Americans. Among the brands were Coinbase and FTX exchanges. The first one experienced so much traffic moments after the broadcast that the effect was the suspension of servers.
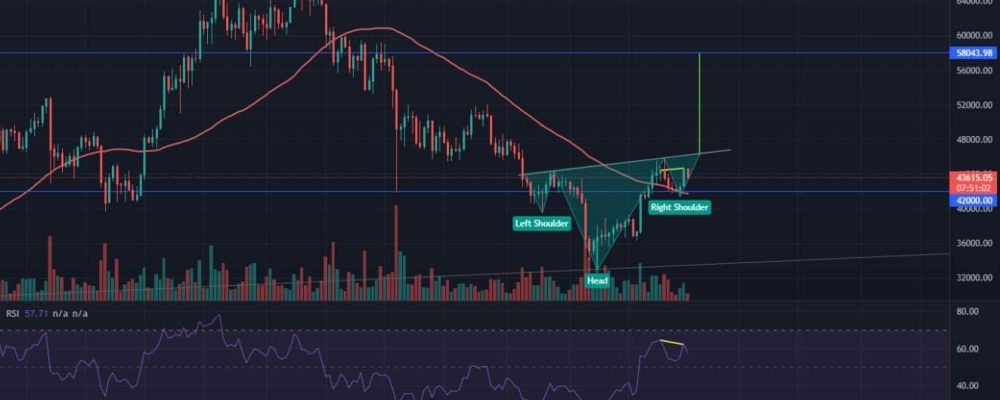
The day after the Super Bowl, Bitcoin managed to break away from the 50-day moving average (red line). This is quite a significant sign, as we can see that in the preceding days, on smaller time intervals, it struggled to hold it. It has also allowed it to bounce off the $42,000 level, where it has also found support so far. Meanwhile, we are seeing the potential outline of an inverted head-and-shoulders formation. It is not yet filled, as the neckline has not been broken through. During the eventual breakout, it is worth watching the volume, as it will confirm the strength of the trend. The price target after the breakout may be near $58,000, which is also where the previous local resistances are located.
Negative signals are also appearing, suggesting downward movement. On the RSI we see a bearish divergence (yellow lines). Remember that the RSI refers to the closing price, so it is the level at which the candle closes that should be considered, not the level that the wick reaches. This divergence could indicate a reversal in price movement and perhaps another test of the $42,000 level.
Data from the network looks very promising
Looking at the data that Glassnode provides us, we can see that the market is looking very bullish. The amount of Bitcoin stored on exchanges, has reached another 3-year low of 2,503,613.482 BTC. The steadily decreasing amount of Bitcoin in circulation, in the long run, has the power to trigger a supply crisis that could push the market to the upside.
Equally benefiting is the Hash Rate. This one led to a new ATH breakout in a rather abrupt manner. An increase in the power of the mining network very often goes hand in hand with an increase in the price.
Also interesting is the recently mentioned Dormancy Flow chart. This indicator has historically repeatedly shown the bottoms of corrections. As it is presented on Twitter by @OnChainCollege, the value of Bitcoin has just left the critical level and if the historical data is to be believed, the road to growth should now open for the leading cryptocurrency.
Geopolitics in the background
From the above data, especially those on Bitcoin flows, it is clear that BTC is programmed for growth. However, the current geopolitical situation effectively makes clear moves difficult. This was evidenced by the way the king of cryptocurrencies moved around the 50-day moving average. When trading virtual assets at the moment, remember that in difficult global situations, technical as well as on-chain data can dynamically reverse. Therefore, it is worth exercising caution.


