Excellent intra-market news is fueling a surge in the value of BTC. This allows the market to maintain a bullish structure. The question, however, is whether it will be maintained for the long term. Let’s check what the indicators say about it!
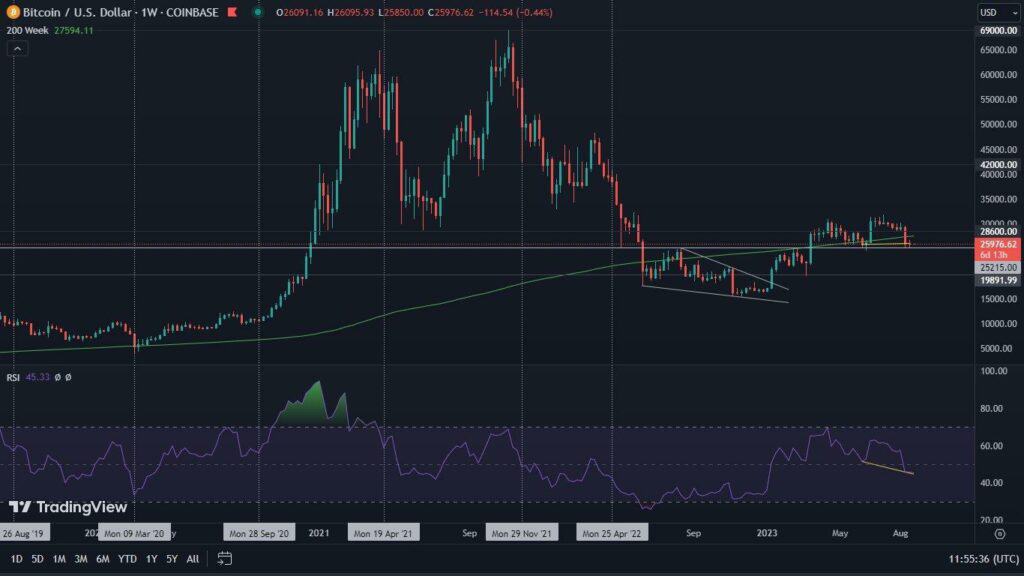
Bitcoin on the weekly chart
A key element driving the increases, became the court victory that Grayscale won over the SEC. We discuss this case more extensively in a separate article. Nevertheless, the information on this subject saw the light of day on Tuesday, August 29. By force of fact, they were not included in the weekly chart, which updates every Sunday, at midnight UTC time.
So how was the weekly interval prior to this event?
Well, Bitcoin recorded a decline of 0.4% in its dollar value. The RSI reached a level of just over 45, a fact that heavily favors the bears. The 200-week SMA has not been recovered, which makes it likely to be a very significant resistance from now on. On the other hand, a positive aspect of the chart is the bullish divergence of the RSI. The whole thing is completed by the fact that Bitcoin has clearly bounced off support at the level of $25,200 for the second time.
Bitcoin on the one-day chart
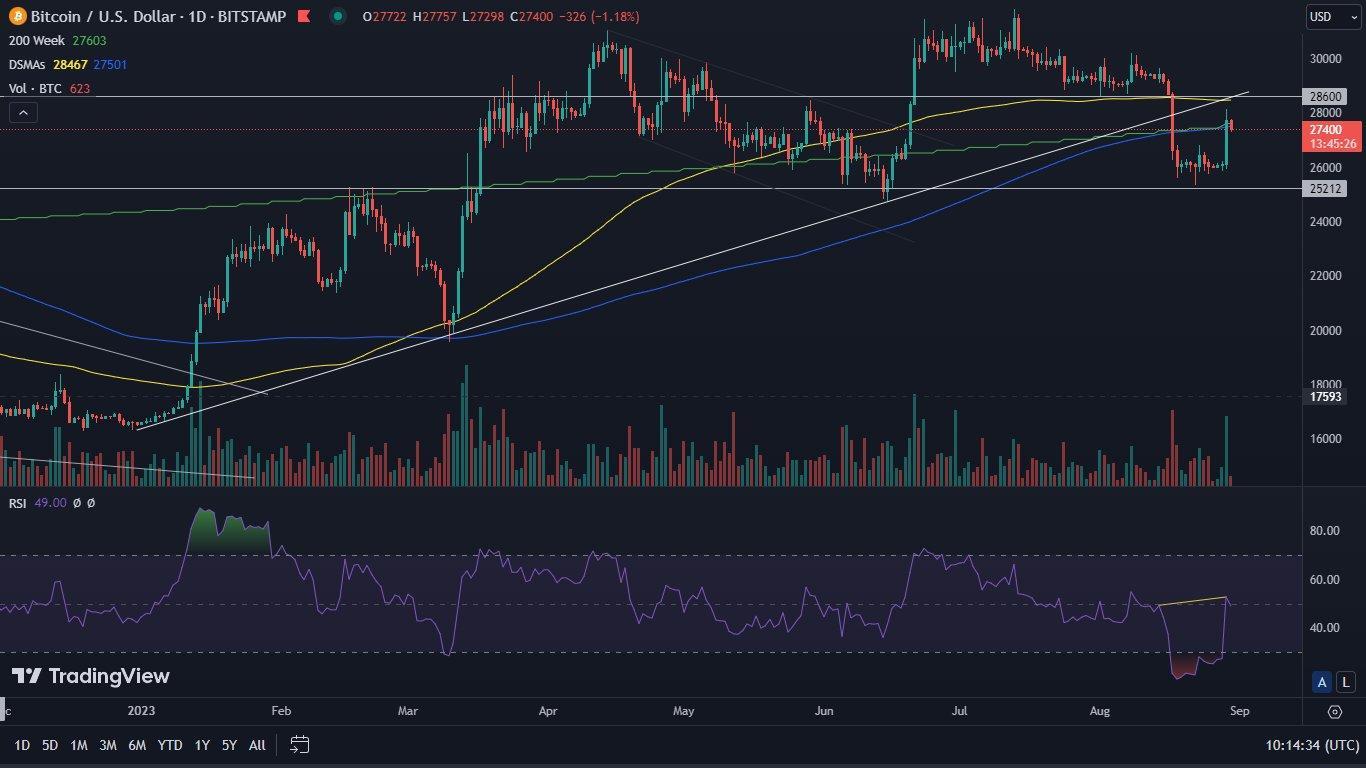
In the previous analysis, we highlighted the significance of the support at the level of $25,200. We noted that at the same time, Bitcoin experienced a bullish RSI divergence. MACD was looking for a turning point, and TD Sequential suggested a consolidation or even a breakout. The culmination of the information coming from the indicators proved to be unmistakable, resulting in the initially mentioned consolidation and the subsequent strong upward movement.
August 29 proved to be a key day. It was then that Bitcoin gained 6.2% in value. This increase was supported by volume. Significantly, the 200-week moving average (green line) and, coincident with it, the 200-day SMA (blue line) were thus defeated. At the time of writing, this analysis is in the midst of a difficult struggle to sustain them and establish support.
Potential resistance is also forming quite clearly. We expect that the price level of $28,600 will become difficult to break through. All due to several factors. The first is that it is a natural horizontal resistance level, which until recently acted as support. The second impediment is the upward trend line, which has been in place until recently, and which also fills the area. In addition, the region is supported by the 100-day SMA, which has historically functioned as a significant bounce point. The whole is completed by the presence of a local bearish RSI divergence.
Despite this, the chart structure remains bullish. Potentially, Bitcoin has just marked a higher low on the chart. This, in turn, may result in the formation of a new uptrend line.
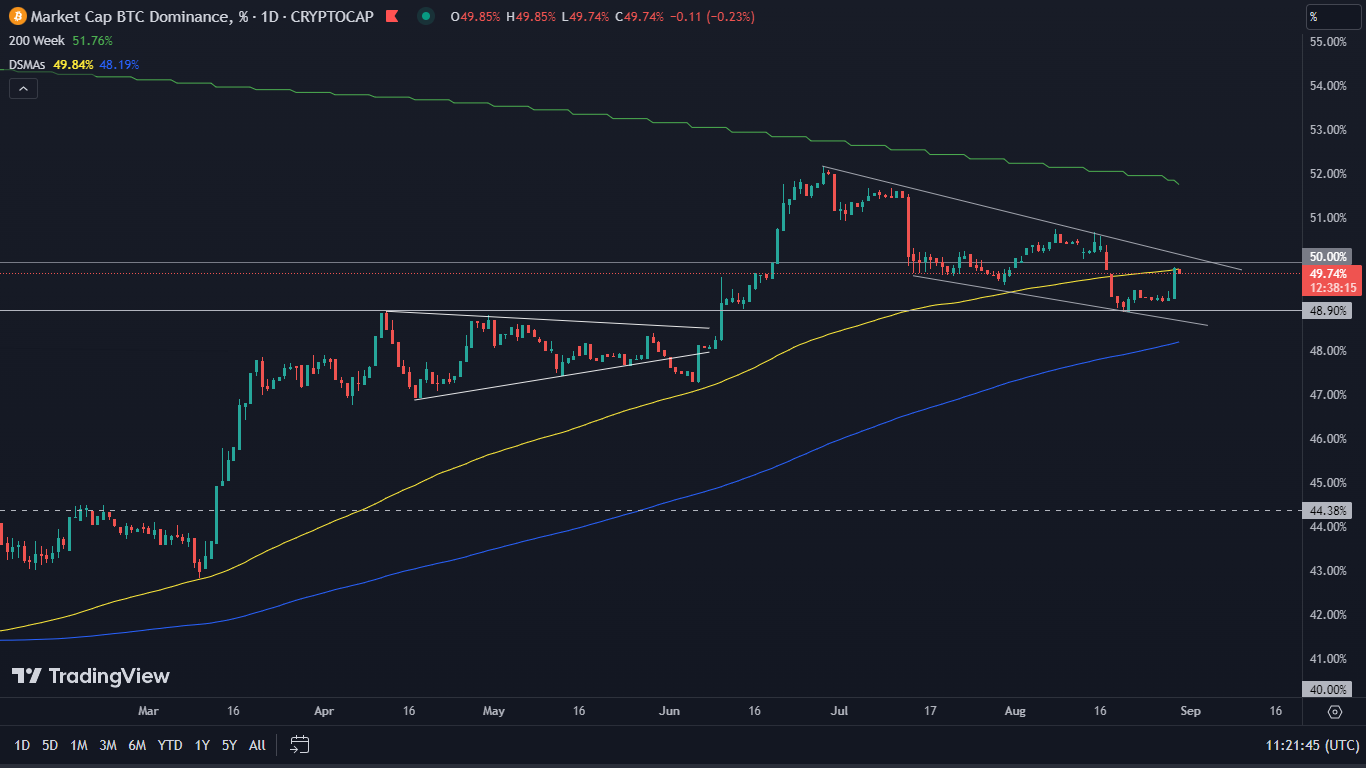
Bitcoin’s dominance at the next important point
Through the prism of the moving averages applied to the Bitcoin to dollar chart, we will also look at the dominance of BTC itself. Thus, we can notice the 200-week SMA (green line), which for the moment marks a resistance zone. In opposition to it is located the 200-day SMA (blue line), which in turn marks a zone of potential support. The whole is completed by the 100-day SMA (yellow line), determining local trends. It is on it that the current upward movement stopped. The structure of the chart after rebounding from support and maintaining the descending channel formation remains bullish. Breaking the 100-day SMA may open the way for an even greater strengthening of BTC’s market dominance.