Bitcoin breaks through the $42,000 level, at times reaching much higher. Will this area, which is technically a very strong resistance, be held as support? Let’s see what the indicators tell us.
Bitcoin on the monthly chart
We begin our analysis by looking at Bitcoin’s situation in a broad time frame. November ended for the leading cryptocurrency with gains of 8.8%. The RSI managed to reach the level of 58. The MACD in such a situation obviously maintained a bullish momentum. Most importantly, however, the price of BTC is balancing above all key moving averages, indicated by us in our analysis a month ago.

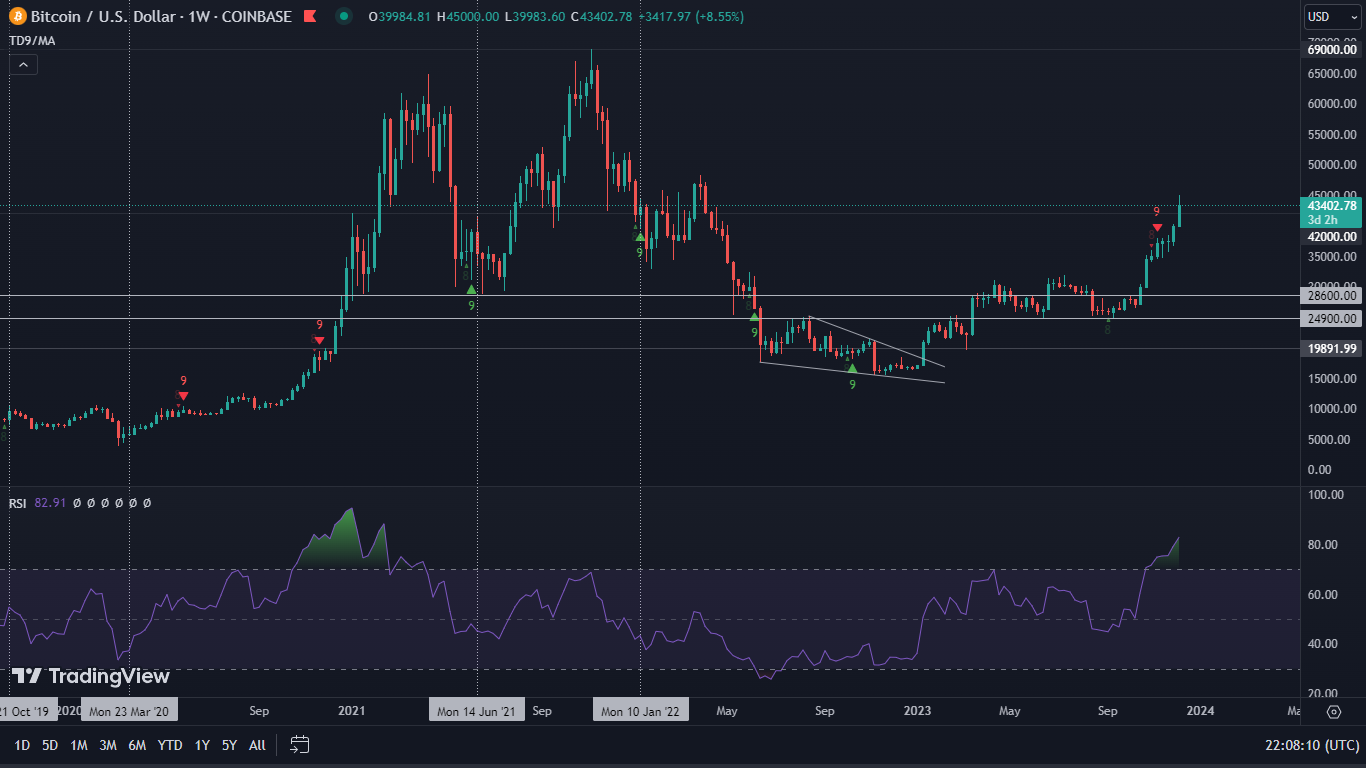
Bitcoin on the weekly chart
Bitcoin’s weekly interval also shows a very bullish structure. Here, however, there are a number of warning signals that should not be overlooked in the analysis. However, let’s start with what is most optimistic. Bitcoin’s price has once again jumped. This time investors’ gains were as high as 6.7%. The RSI, meanwhile, reached 79. It is difficult to find more positive data. After all, TD Sequential has already drawn the twelfth upward candle in a row.
The stochastic RSI is once again close to making a bearish cross. However, this situation has been going on for several weeks and remains unchanged.
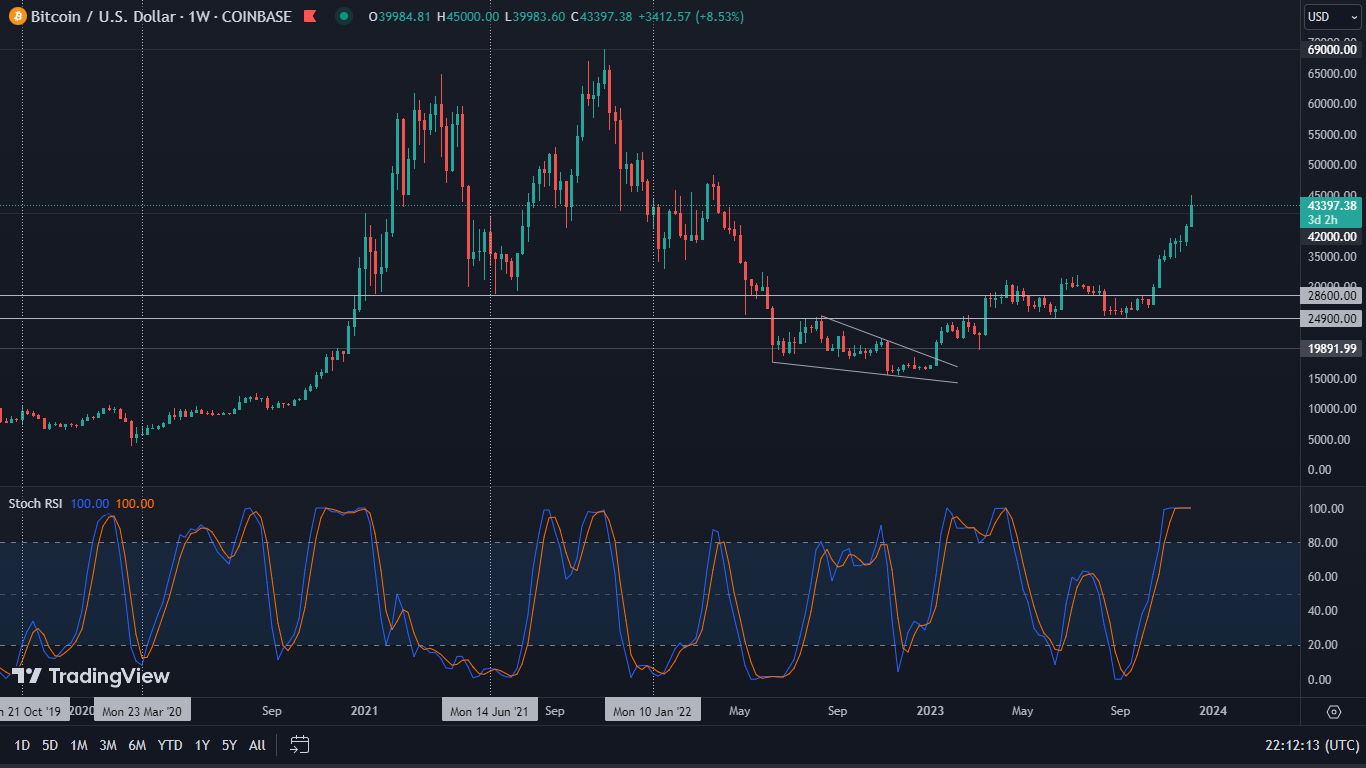
The basic support level to watch here is therefore $32,300. We have been keeping an eye on this value for a very long time. However, the situation on the lower time interval makes it perhaps time to look a little higher.
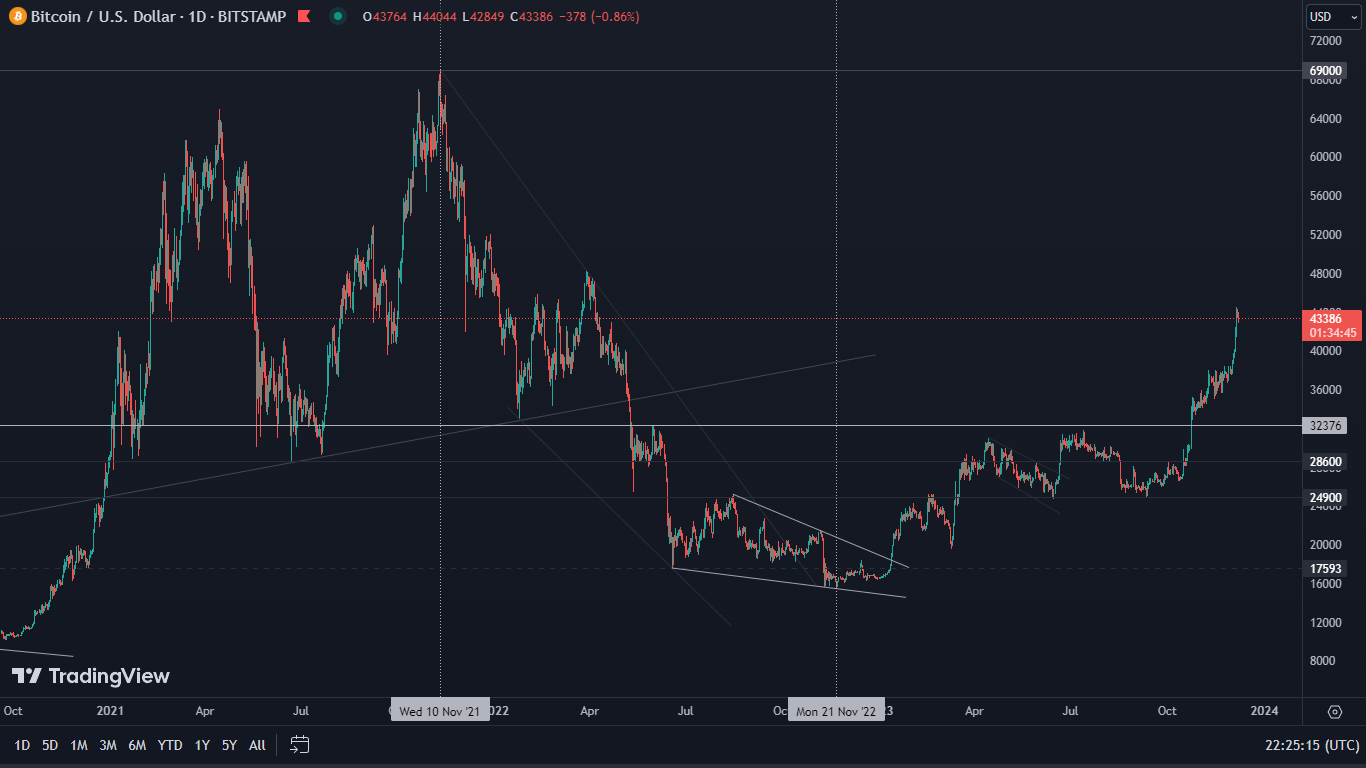
Bitcoin on the daily chart
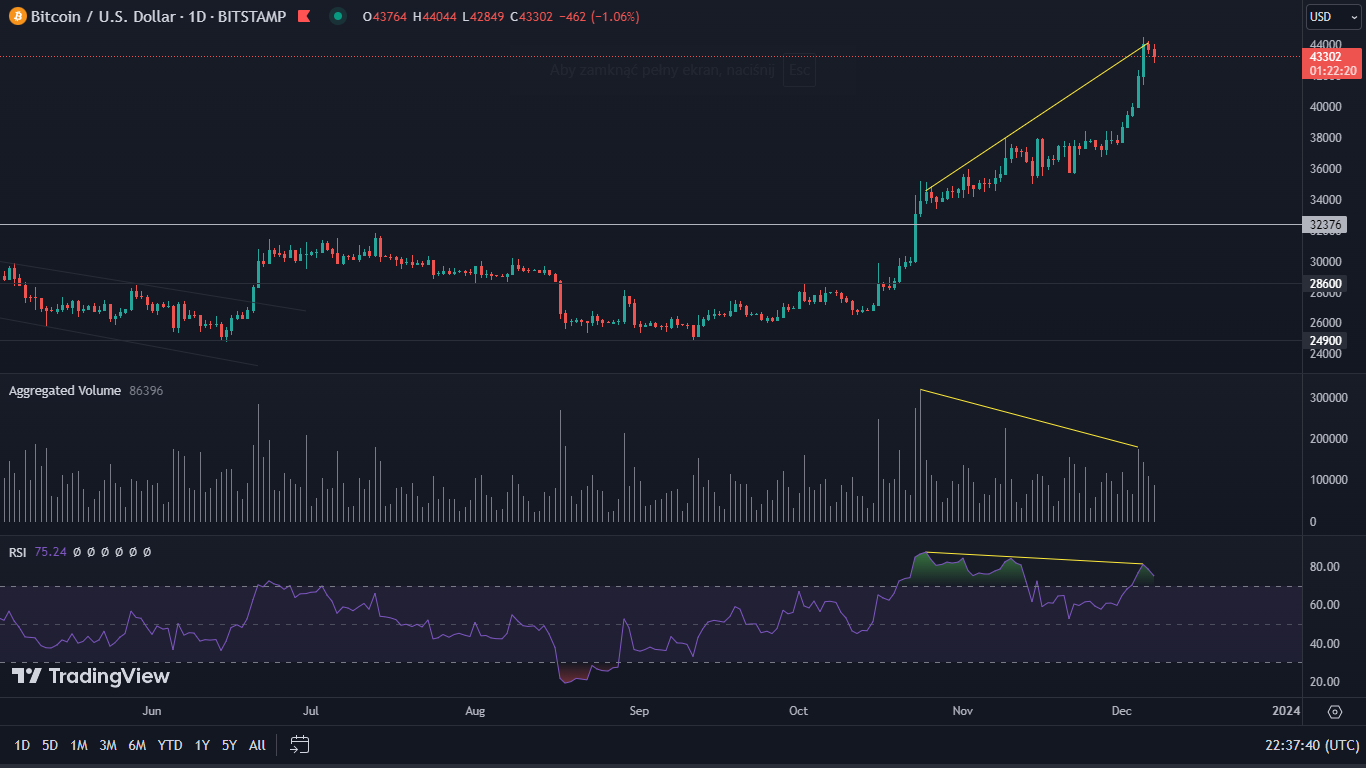
$42,000 is a level that, from a technical point of view, is incredibly important for the fate of BTC. History shows that this very boundary has been responsible for both support and resistance on more than one occasion. Meanwhile, at the time of writing this analysis, Bitcoin is in the area of $43,350. On the one hand, this is cause for optimism, but on the other hand, it is worth taking care to be vigilant, because as it turns out, this area does not guarantee anything. Looking back, especially to early 2022, we can see that BTC has managed to break out above $42,000 on more than one occasion and yet fall even to levels below $35,000. This means that the horizontal zones on the chart have managed to move. Conservative adherence to the original values can therefore be misleading.
Unfortunately, the negative picture does not end with the structure. Indeed, bitcoin has reached a triple bearish RSI divergence. Equally negative is the volume, which has been steadily weakening despite the increases in BTC’s value.
To top it all off, the TD Sequential indicator achieved its ninth consecutive upward candle. The whole is complemented by the ADX, which may be currently forming a new lower peak.
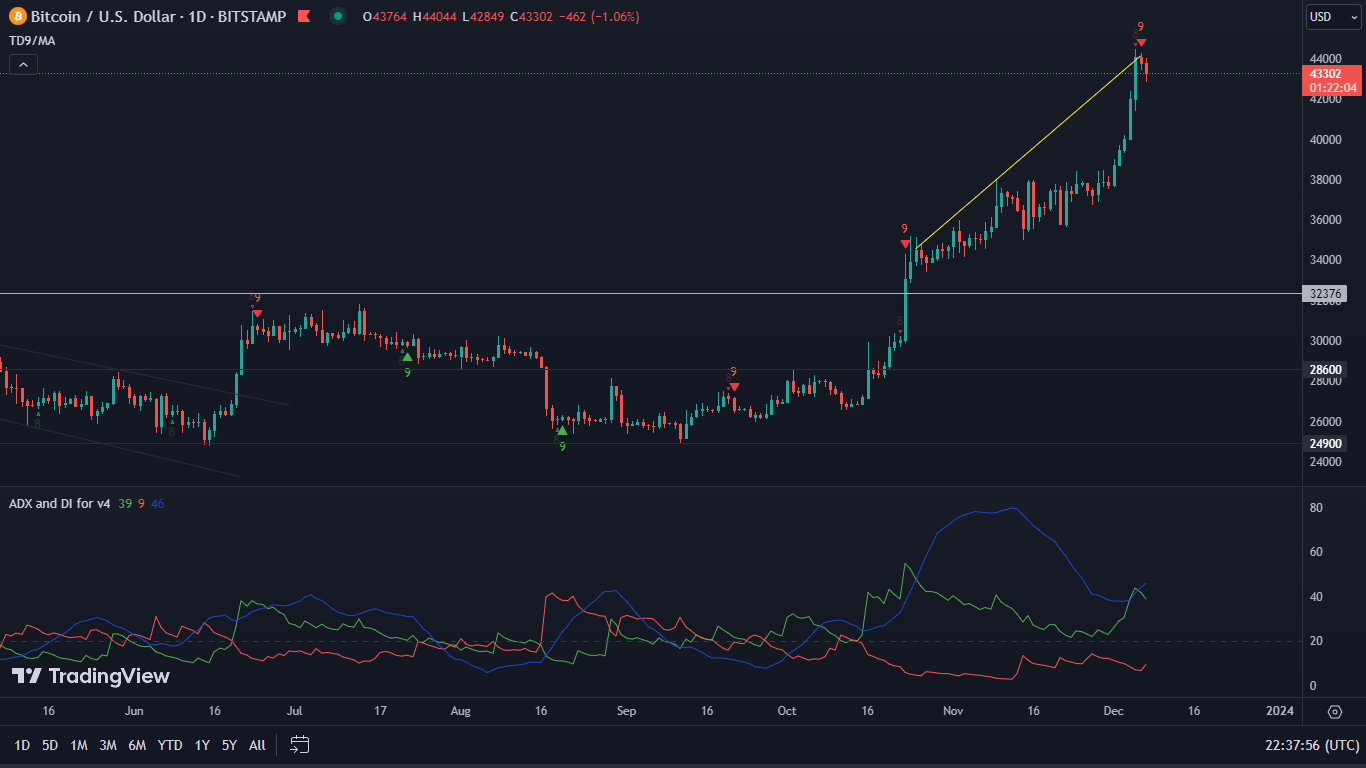
All the indicators presented suggest overbought BTC. Such a situation heralds a correction. Theoretically, it could stop already at the value of $42,000. However, looking through the prism of previous peaks, a somewhat deeper price retreat can be expected. The area around $35,000 will provide strong support. On the other hand, a possible negation of such a scenario could result in a continuation of the increases even to the level of $48,000.
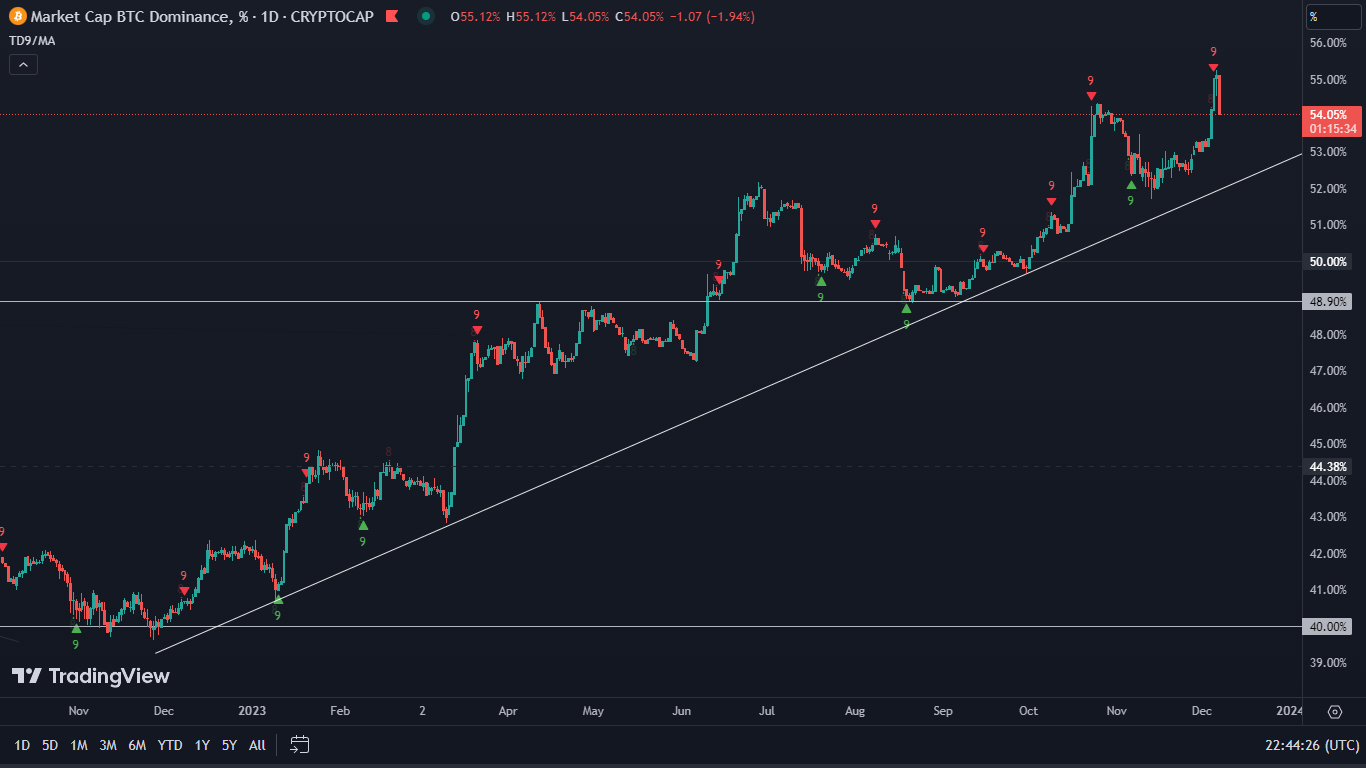
Dominance keeps the trend going
Meanwhile, Bitcoin’s dominance maintains an upward trend. Its current value is close to 54.0%. Although many altcoins are gaining, it is worth remembering that their real season may come only after the line indicated on the chart is broken.