We take a look at the X (Twitter) platform to see what leading market analysts see in Bitcoin’s current price action. Does the leading cryptocurrency face further increases, or is it time for declines after all?
Material Indicators behind the veil of secrecy
The analyst known to us all as Material Indicators (@MI_Algos), on Wednesday, December 20, shared a graphic, which he annotated with the following comment:
“Imagine Bitcoin losing support at the 36.5k level.”
Imagine #Bitcoin losing support at $36.5k 🤔
— Material Indicators (@MI_Algos) December 20, 2023
Use code 6FOR36 for 36% OFF 6 Month Planshttps://t.co/h7jjxJQcPu https://t.co/upoyjair4p
This graphic is a BTC order book on the Binance exchange. It indicates that strong resistance is forming at the $45,000 level. This supply zone has the power to push the price of the leading cryptocurrency to lower price levels. Nevertheless, in the broad sector between the aforementioned value and the $36,500 area, quite a number of buy orders are distributed. However, just below the indicated value there is a complete void. According to the graphic, the absence of orders in this space has the right to result in declines all the way down to the area of $27,000. Sounds dramatic!
However, we clarify that this is only a temporary picture of the order book. With potential declines, this empty space will certainly begin to fill with more purchase orders.
Roman does not expect increases
Roman (@Roman_Trading) is another analyst we heartily recommend you follow. His cool approach to the market is undoubtedly a huge advantage. He, too, shared an interesting analysis on December 20, which he annotated with the following comment:
“A nice little pump so far, but again I think we need to see a much bigger range to create volatility and allow for more upward movement.
Currently, volume is low, so if we get to a ‘breakout’ it will be false, resulting in a retest of the lower part of the range.”
$BTC 1D
— Roman (@Roman_Trading) December 20, 2023
Nice little pump so far but again I believe we need to see a much larger range to create volatility for a larger move to the upside.
Currently volume is low so if we “breakout” it’ll be a fakeout to retest the bottom of the range.#bitcoin #cryptocurrency #cryptonews pic.twitter.com/LPbSeum7nG
Thus, Roman believes that Bitcoin’s movement in the area between $40,000 and $45,000 may take a little longer. Keep in mind, however, that the consolidation bears the hallmarks of a correction, and thus keeping the price at these levels will certainly be healthy for the market.
Crypto-ROD bets on consolidation
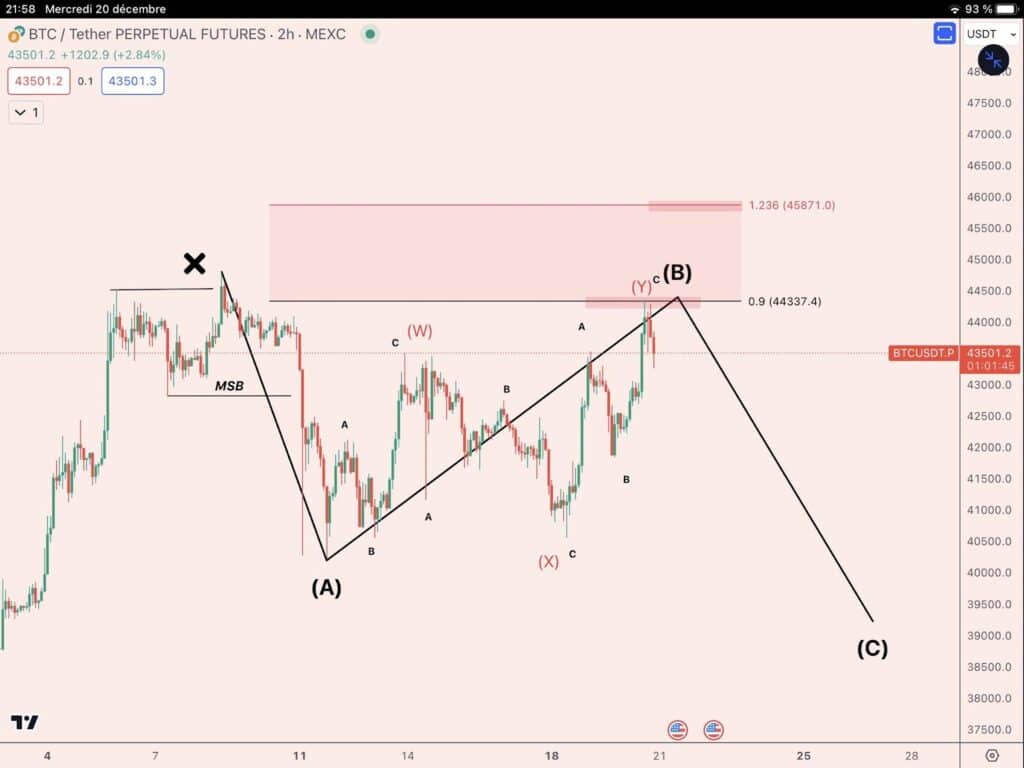
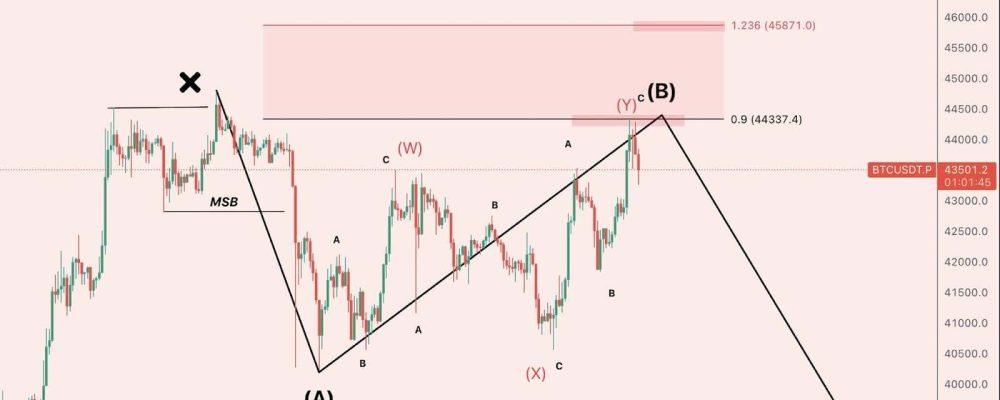
The last analyst we will quote today is Crypto-ROD (@RodMaartin). He shared with his watchers a chart detailing Elliott Waves, supported by Fibonacci elimination. As he reports:
“Looks like a WXY consolidation. Bitcoin with a perfect hit at the 90% Fibonacci level.
If we squeeze higher, we can take advantage of the fib level of 123.6.
I remain with this plan and continue to wait for a larger consolidation move.”
$BTC Elliott wave count update
— Crypto-ROD (@RodMaartin) December 20, 2023
Looks like a WXY consolidation here on #Bitcoin with this perfect hit at 90% Fibonacci
If we squeeze higher we can go to 123.6 fib level too ✍🏽
I stay with this plan & still wait bigger consolidation move 🫶🏼 https://t.co/5zTQkuCZvj pic.twitter.com/rfTu5EnREL

Crypto-ROD thus confirms what the above-mentioned analysts have noted. A consolidation move for Bitcoin seems highly likely. The area to watch out for, in his opinion, is in the space between $39,000 and just under $46,000.
Blockbulletin analysis
Meanwhile, another of our original analyses will be published soon. If you want to stay up to date, be sure to follow us on X (Twitter) and look at blockbulletin.com
We share analyses of Bitcoin charts along with their interpretation every week – don’t miss them!


