

We’ve been showing you Bitcoin’s price action from our perspective for a while now. Today we’re going to show it from a completely different angle. Read the insights and predictions of other well-known experts in the field. We guarantee that they are very interesting.
Material Indicators points to levels worth watching
A Twitter user known as @MI_Algos is using so-called FireCharts to identify the levels at which there is currently the most interest in both buying and selling Bitcoin. In a tweet dated Friday, April 14, he shares the graphic below, as well as insights.
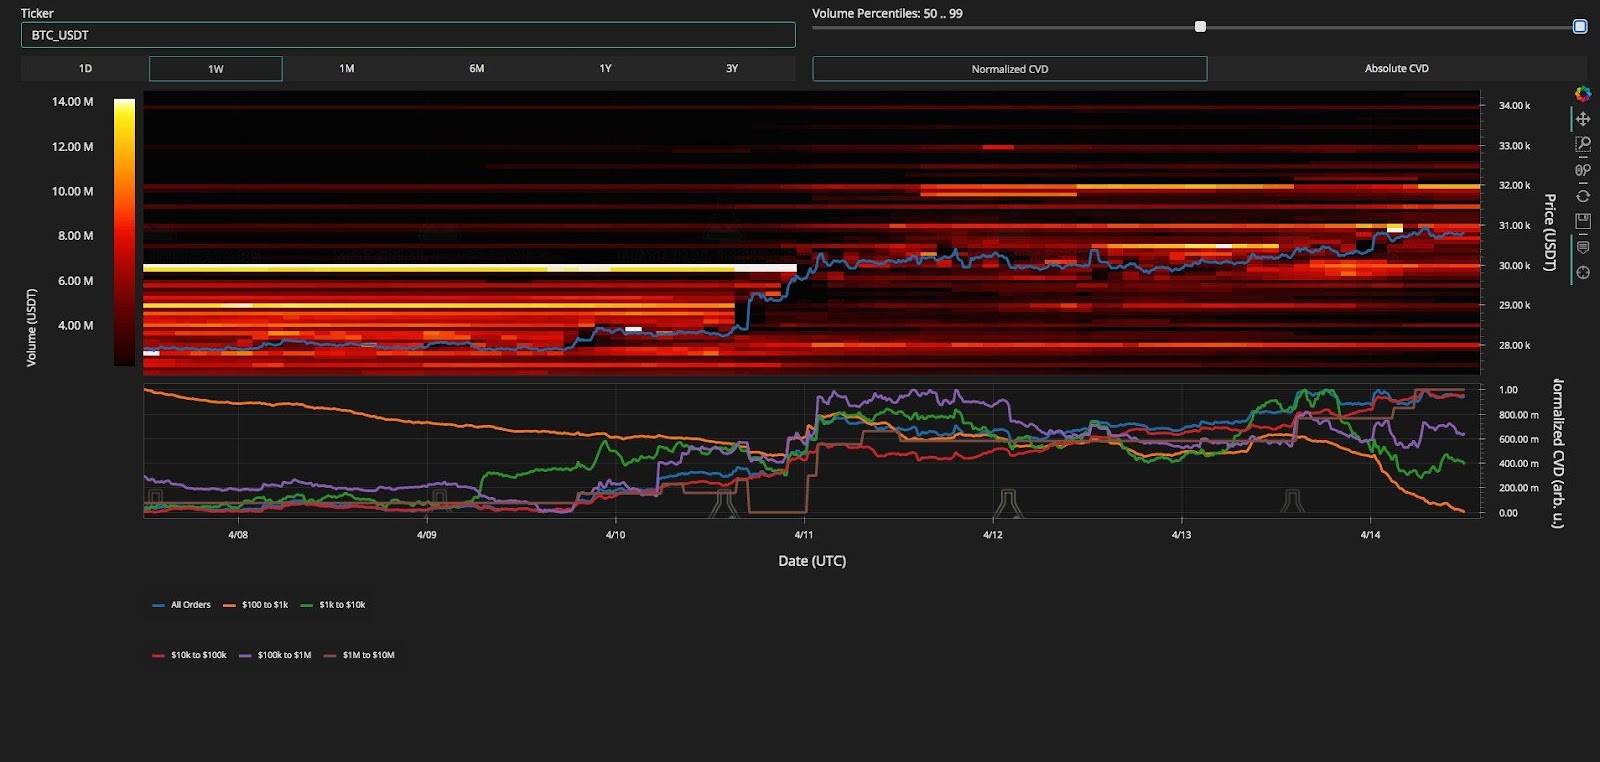
“It’s Friday and it looks like there is a battle going on over the Bitcoin trading range. It’s a liquidity game and it’s all about which side has the highest concentration of liquidity creating walls, the greatest depth to secure those walls and reserves to replenish the liquidity that has been drawn down.”
Maartuun notes that investors are shifting their focus to another asset
In our last analysis, we highlighted Bitcoin’s dominance chart and the possible upcoming altcoin season. This theory seems to be confirmed by observations made by @JA_Maartun. The analyst, on his Twitter account, shared the following data:
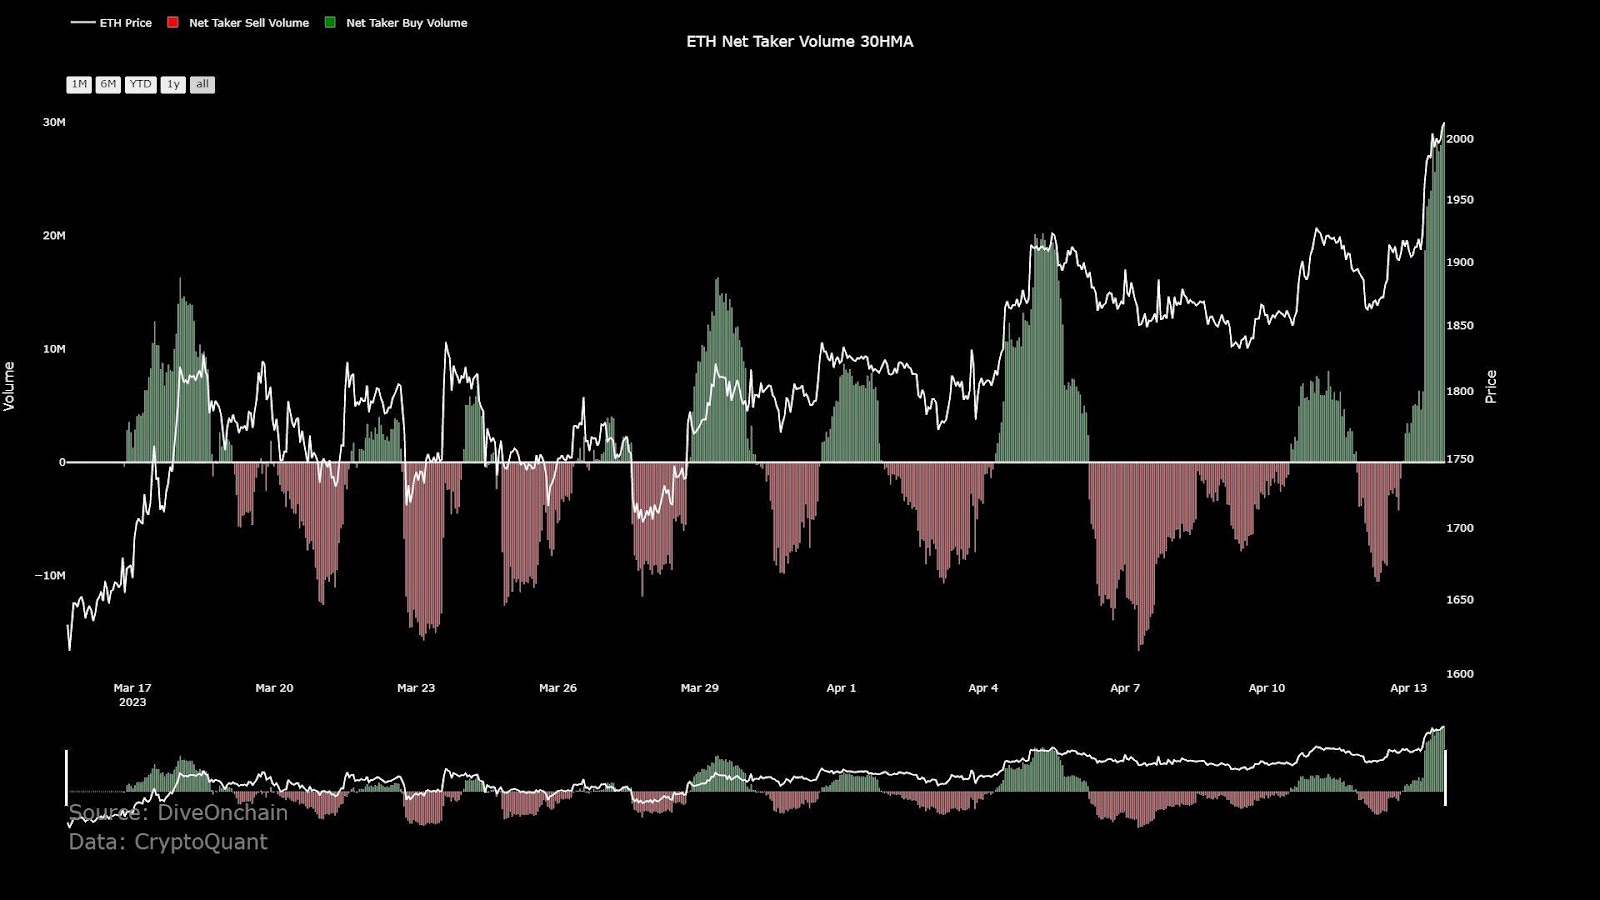
“See the difference between Bitcoin and Ethereum. There is almost no strong buying in the Bitcoin market in recent hours, but there is on Ethereum. It’s been a long, long time since we saw this.”
As we know, altcoin season usually takes place when investors lose interest in Bitcoin, and their attention shifts specifically to Ethereum, to later turn to lower-capitalization coins. The above observations were made on Thursday, April 13. It is worth watching whether this situation will be maintained in the following days.
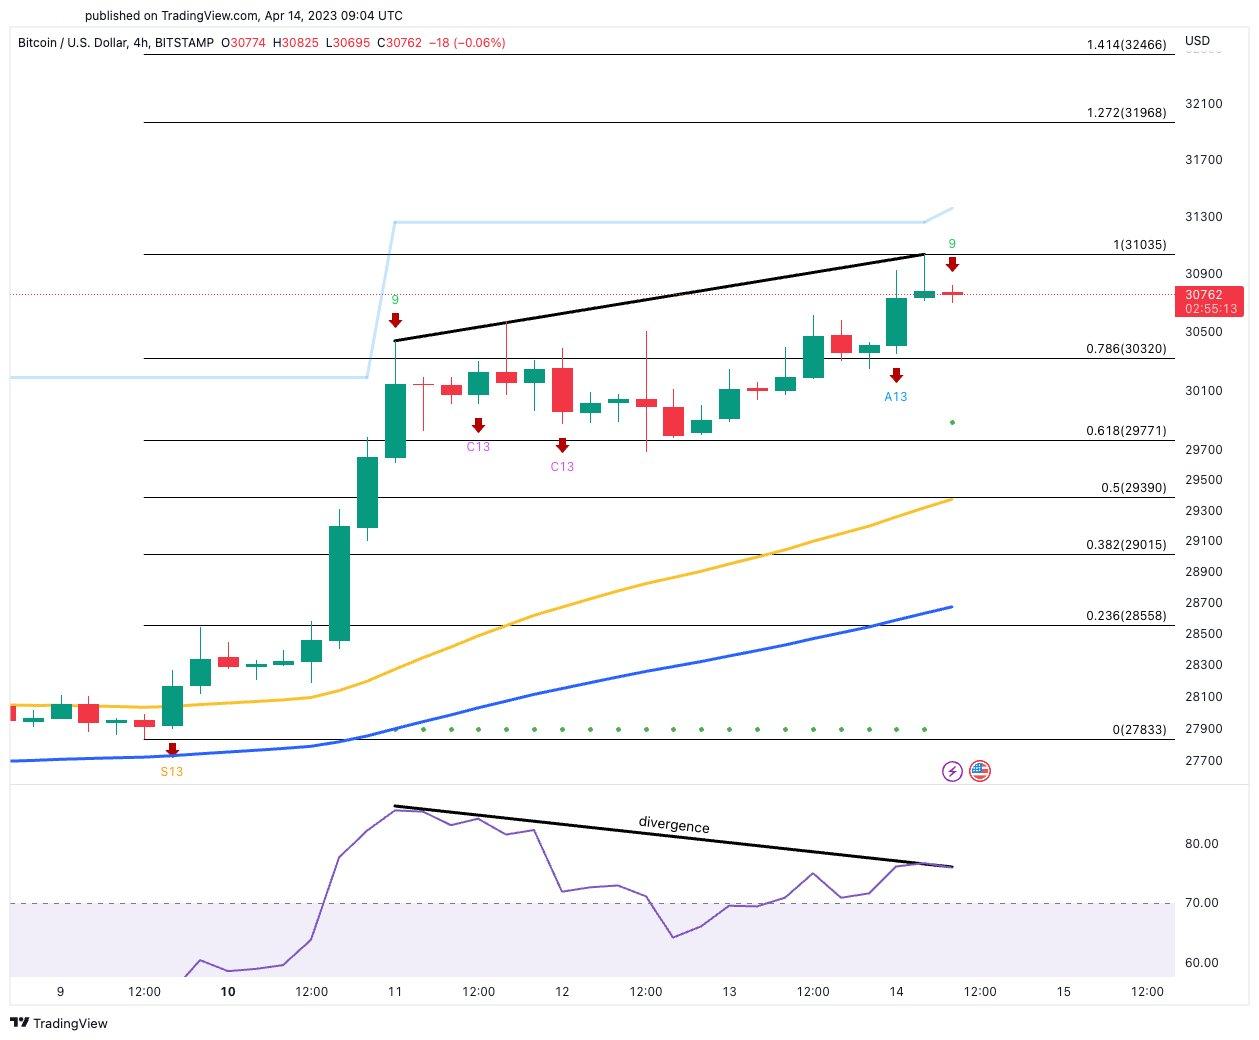
Roman on the four-hour chart observes Bitcoin’s depletion
@Roman_Trading is an analyst looking at the Bitcoin price in both the short and long term. He, too, shared his observations on Friday, April 14. He tweeted the following graphic and captioned it as follows:
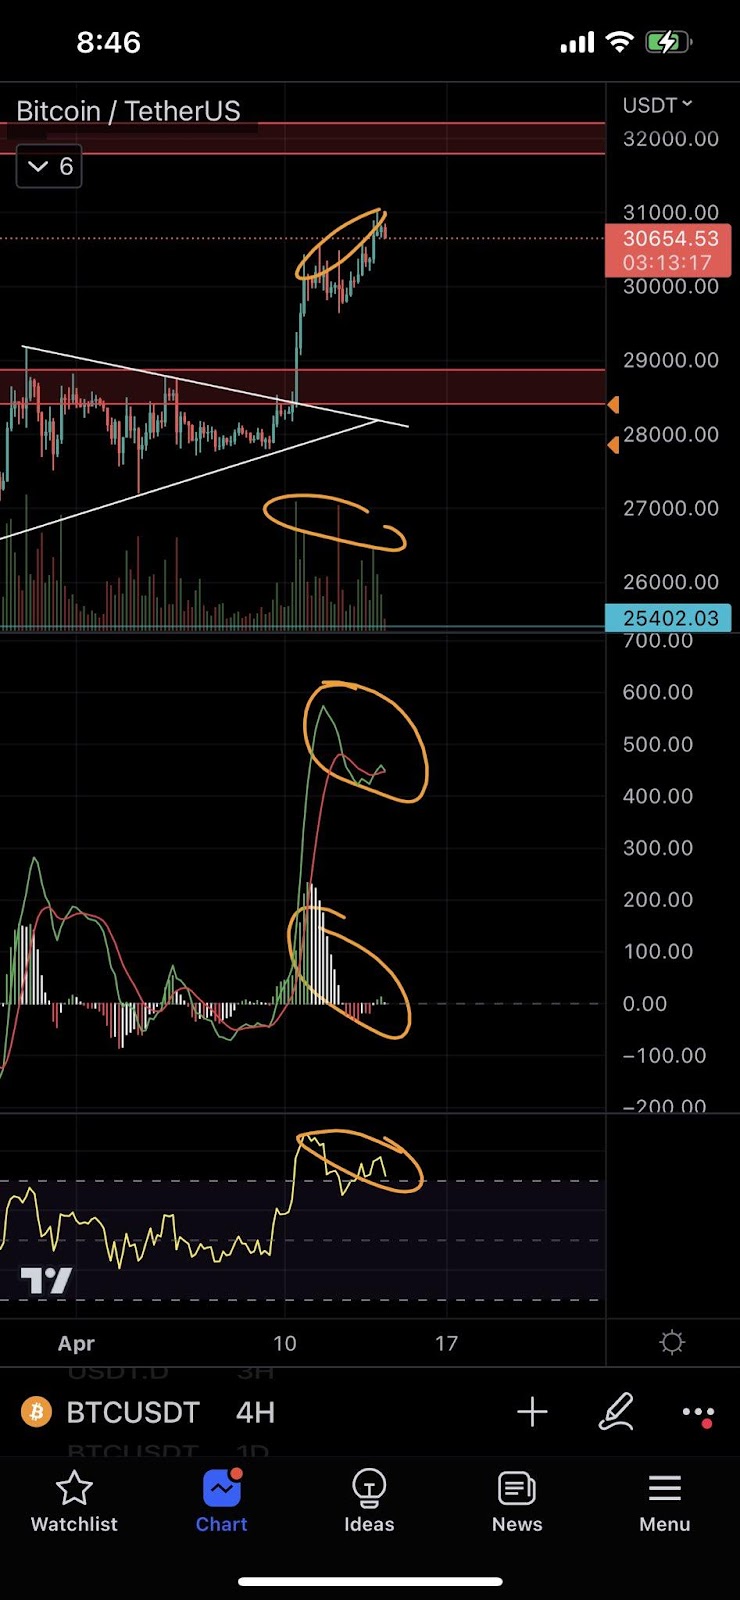
“BTC on H4.
Pumps are great, but now we see signs of exhaustion and altcoin pumping, which generally means the end of the move. Bearish MACD/RSI divergence, bullish exhaustion of price action and loss of momentum. I would not look for longs here.”
Ali also bearish, although he points out possible invalidation
@ali_charts also shows a bearish stance on Bitcoin’s short-term price action. He, too, points out the divergence, and points to another important indicator that may suggest a trend reversal.
“A potential short-term correction is coming! TD Sequential on the 4-hour chart is signaling a sell-off, which combines with the bearish RSI divergence. Closing the 4-hour candle above $31,000 could serve as a reversal.”


