

There is no denying that the wide price zone set around $30 thousand is one of the most important areas in the history of BTC. It is it that is currently assessed as the boundary between bullish and bearish territory. Its successful breakthrough could herald the end of the bull market. Is it about to take place?
Bitcoin on the weekly chart
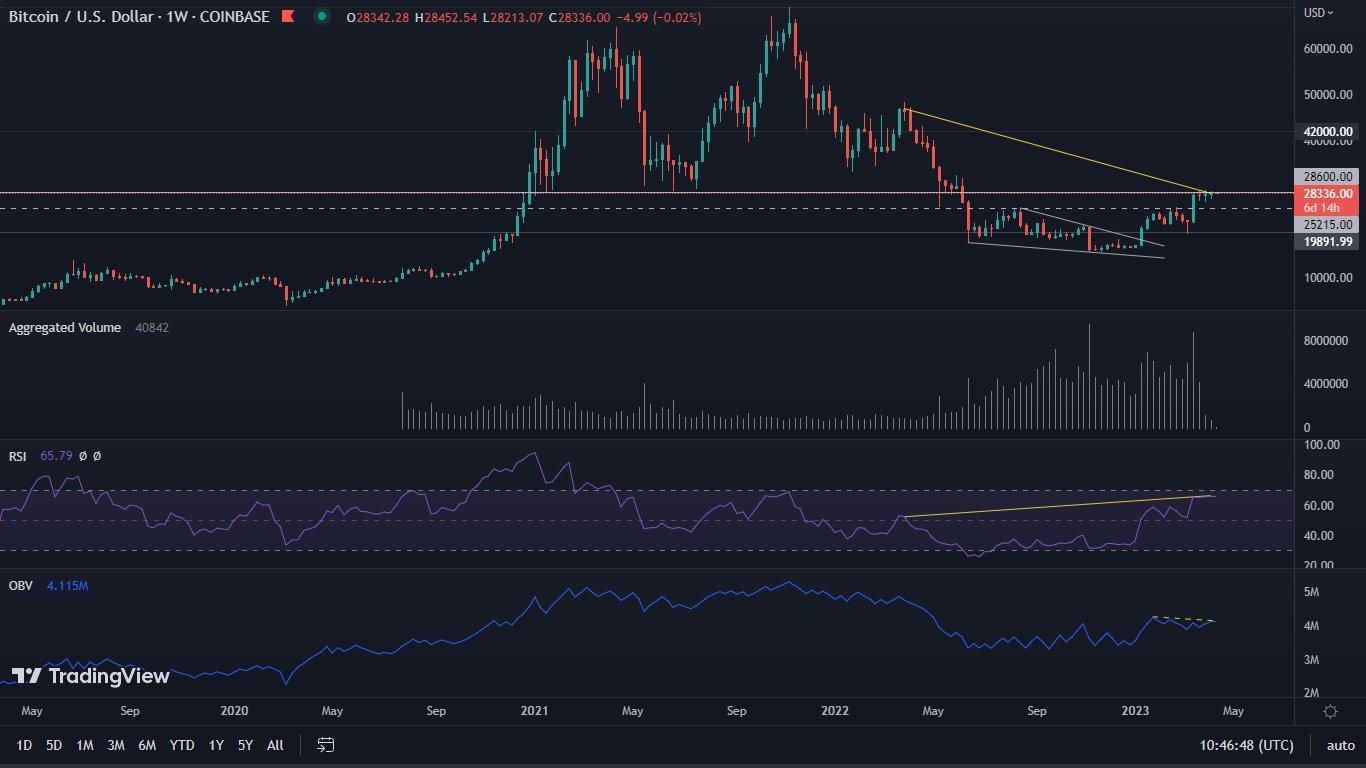
On Sunday at midnight UTC time there was another closing of the weekly candle. As it turned out, the chart compared to the events of seven days ago, recorded almost no changes. The exception is one small detail.
So, analyzing all elements one by one, we see an increase in the value of Bitcoin by 0.55%. The RSI continues to maintain high levels, noting a value of 65. Meanwhile, the same indicator is drawing a very clear bearish divergence. We have been talking about it for a very long time, and, as before, we are now pointing out that it may widen further. Volumes remain very low. OBV, like RSI is also forming a bearish divergence.
The key change hosted on the chart, and which distinguishes its current construction, from the picture of a week ago, is the MACD. There are many indications that it is currently in a bearish turning point. In addition, the Stochastic RSI, continues to form a new peak in the overbought zone, and the ADX still does not qualify the ongoing trend, as strong.
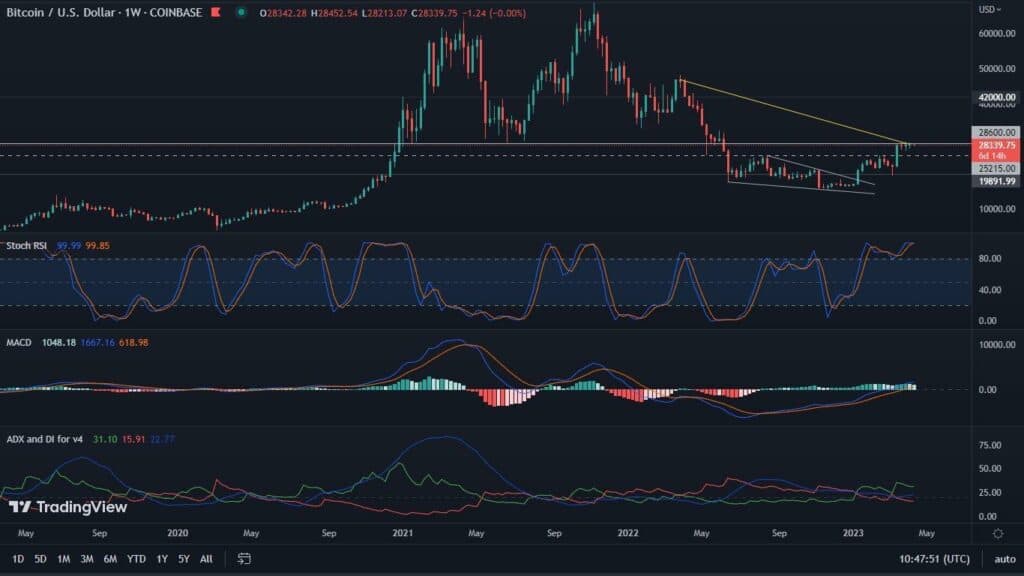
Thus, we see relatively many bearish signals, or even warning information, on the chart. Nevertheless, just after the close of the week, the price managed to break through the $30,000 level. Will it therefore be maintained?
Bitcoin on the daily chart
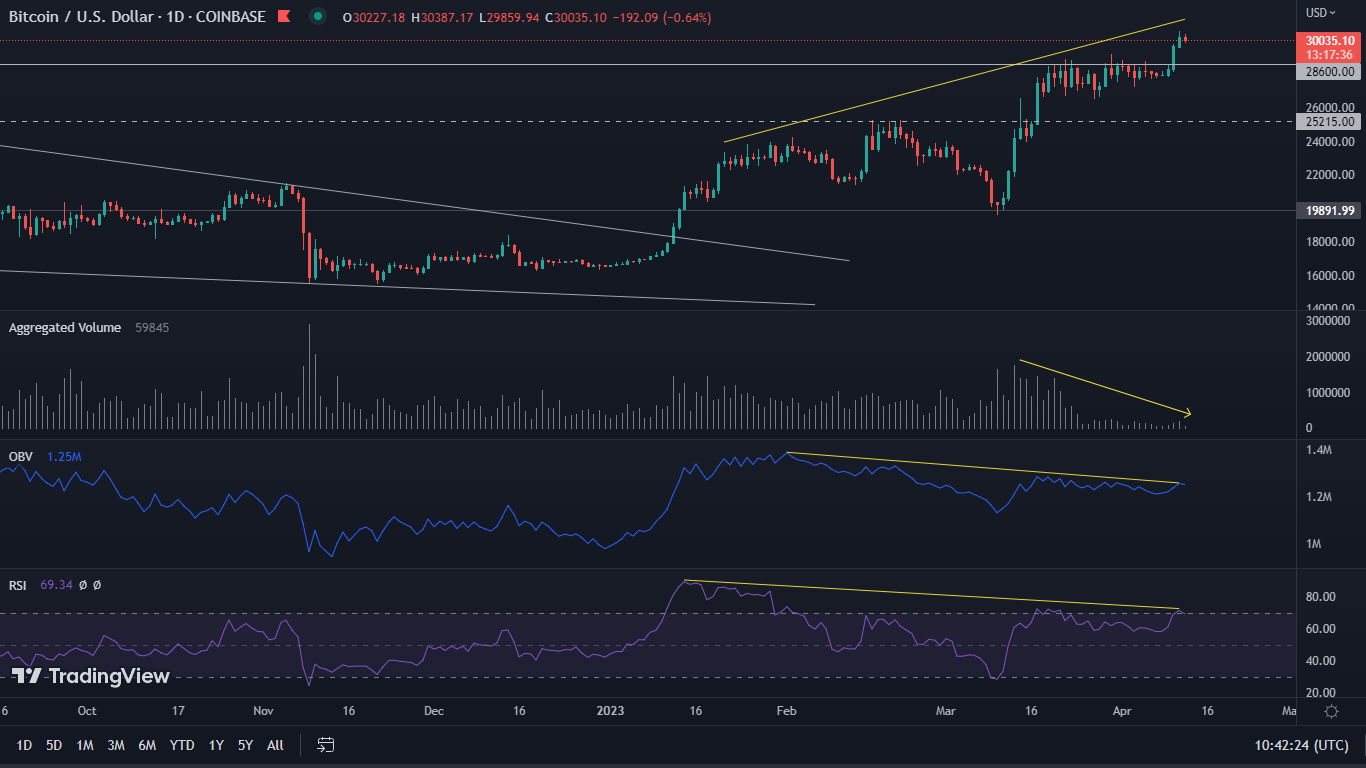
USD 30,584.58 is this year’s new peak that Bitcoin recorded on the Coinbase exchange. This is 85% higher than the price with which BTC opened in January. It also represents a 97.9% increase from the bottom reached last November.
As a result of these increases, the daily chart is beginning to send out a number of mixed messages. Let’s start with the less favorable ones, moving later to the slightly more positive ones.
The first one we observe is again the very low volume that accompanies the attempt to break through the $30,000 level. In doing so, it is worth noting that the total resistance zone is between $29,000 and $32,000. This band is very wide, and only after its successful overcoming and confirmation as support, we will be able to talk about the return of the price to the territory of the bulls. A successful breakthrough of this zone should be coordinated with increasing volume. Meanwhile, this one remains weak and, compared to previous local peaks, is even declining and therefore showing a bearish divergence. Indicators such as OBV and RSI are also signaling a similar one. These signals could mean that we are witnessing a false breakout, which could result in declines. If such happens, it is not impossible that BTC will once again descend to levels near $25,000.
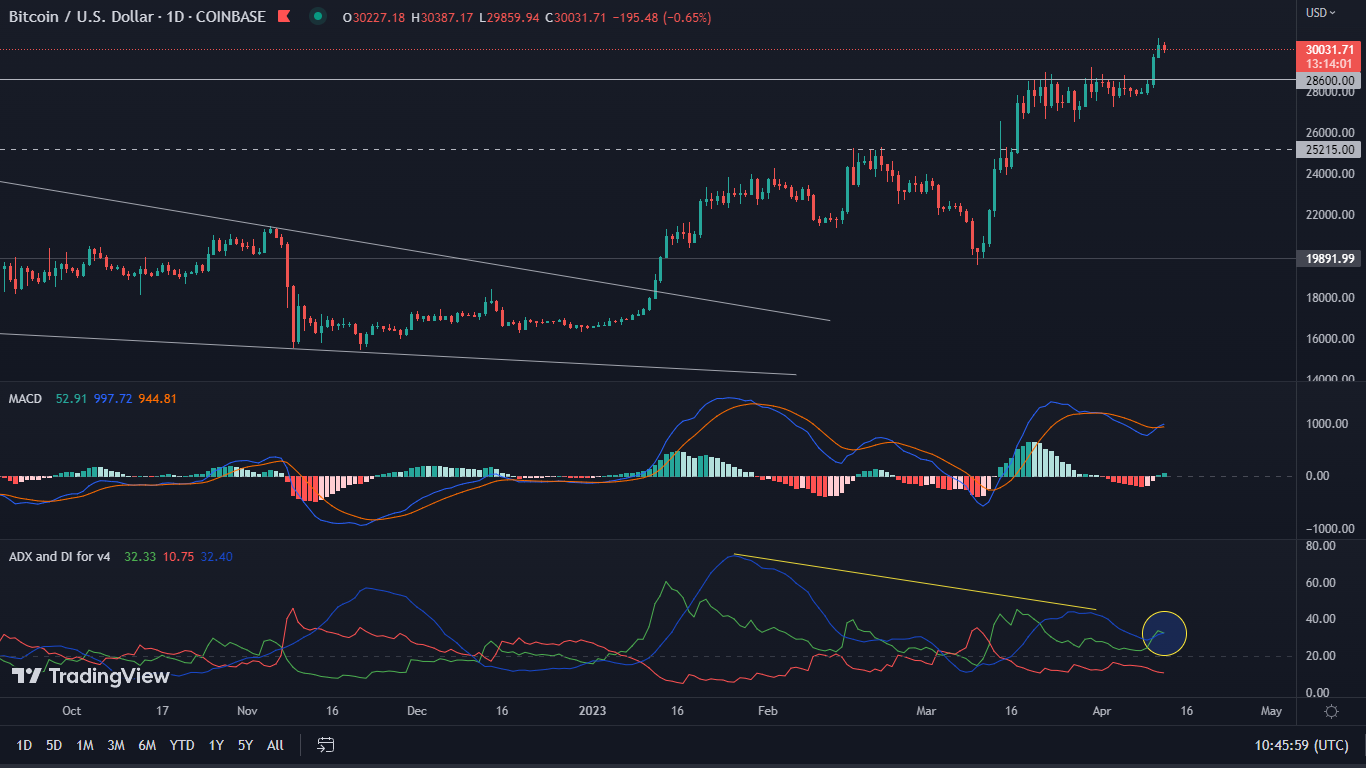
However, as we mentioned, the daily chart is not only bearish signals, but also bullish ones. One of them is the MACD, which has made a positive cross. Another, however, is the ADX, which seems to qualify the trend as strong. This may result in the formation of a third peak on the indicator, and thus a broadening of the bearish divergence in this case. However, time will be necessary for it to play out.
Time for altcoins?
Looking at the Bitcoin dominance chart, we can say that the target has been reached. The gray rectangle, which we already drew out earlier this year, is a strong resistance level. Bitcoin touches it at a time when it is accompanied by a bearish RSI divergence, as well as a bullish MACD. If the historical data is confirmed, the near term could result in increases for many key altcoins.


