Bitcoin’s day in El Salvador, is also a day of strong market correction. The leading cryptocurrency is retreating on the charts by nearly 20%.
Causes and consequences
We can find many reasons for such a strong correction. However, one is crucial. The introduction of Bitcoin as legal tender in El Salvador clashed with the opinion of the International Monetary Fund. The International Monetary Fund maintained its opinion that Bitcoin, if only due to its volatility, would not be able to fulfill such an important role in any country in the world. The deep correction that occurred on September 7 could confirm this thesis. It can also be speculated that this event fueled prolonged buying pressure to eventually drive the price down, selling it as fact. Interestingly, the Salvadoran government, in order to provide liquidity to its internal market, decided to capitalize on the drops and purchased more BTC for its holdings. This was reported by President Nayib Bukele, who, seeing the correction as a real promotion, bought another 150 Bitcoins.
What the Bitcoin chart tells us
Bitcoin has risen 80% in 48 days, without scoring any major correction along the way. This has the effect of leading to a situation where the market needs to unwind and take profits. Such a situation is very healthy and even needed.
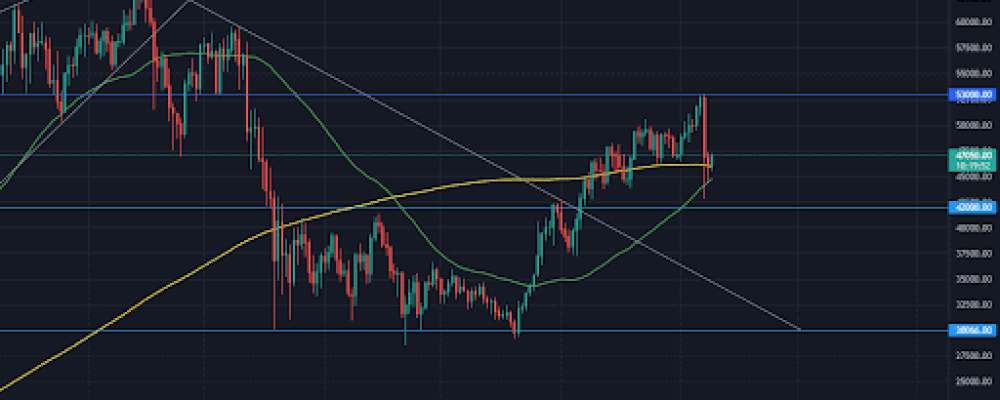
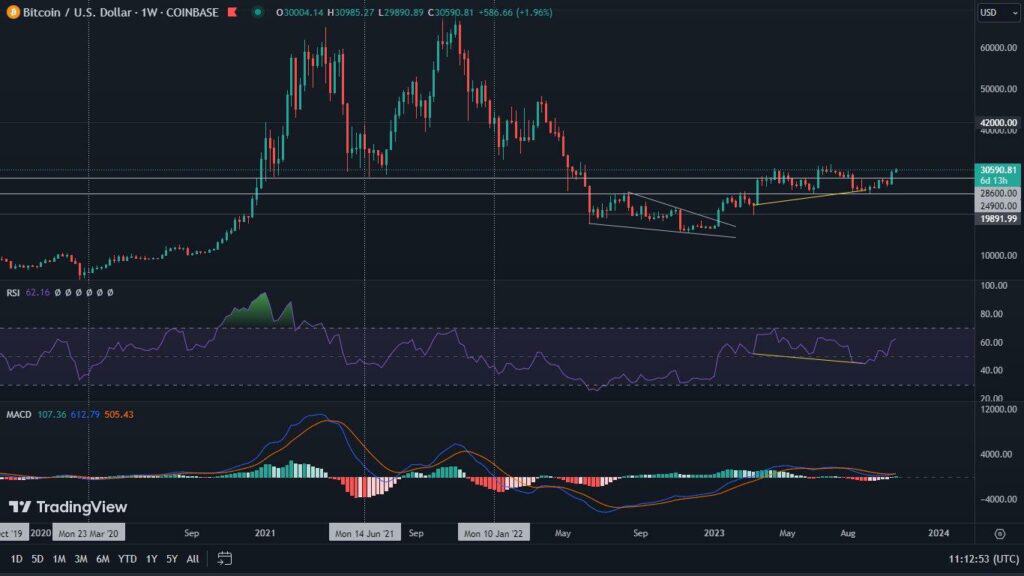
In the last analysis of Bitcoin we highlighted the bearish divergences formed on the RSI and MACD. They were eventually played out resulting in declines. These in turn drove the BTC price to the key area between $42,000 and $43,000. This is a region that the Bitcoin price has already reacted to several times. We also pointed to it recently.
Market participants treated this correction as an opportunity, which resulted in an immediate rebound of the price and its return above the 200-day moving average (yellow line). As this was historically a critical bull market support point, it is good to see subsequent daily candle closes above this level. Watching the moving averages, it is also worth noting the upcoming golden cross resulting from the intersection of the 50-day average (green line) with the aforementioned 200-day average. Although this is a lagging indicator, it does provide an indication of potential further upside. Depending on the price movement on the chart, the crossing of the aforementioned averages is expected to take place later this month.
Levels to watch
Since we do not notice any key formations on the chart, the existing support and resistance points should be observed as a potential target for the BTC price. Important here is the defense of the 200-day moving average, which is already a point of rebound. Its possible breakout could indicate a renewed move towards $42,000, where strong buying moves occurred during the last decline. These are illustrated by the long wick of the September 7 candle.
Looking at more optimistic scenarios, we should pay attention to $53,000. This is the local top of the uptrend and the point from which the correction occurred. A breakout of this area should take BTC to the region between $55,000 and $61,500, which we mentioned in a previous article. A longer stay for Bitcoin in this zone seems very likely.

