

Recent days in the cryptocurrency market have resulted in fear. Bitcoin broke out of support, reducing its value to levels below $25,000. However, this situation was short-term, so we immediately saw a rebound. In the meantime, however, a death cross appeared on the chart. In today’s analysis we will discuss its historical impact on the price of BTC.
Bitcoin on the weekly chart
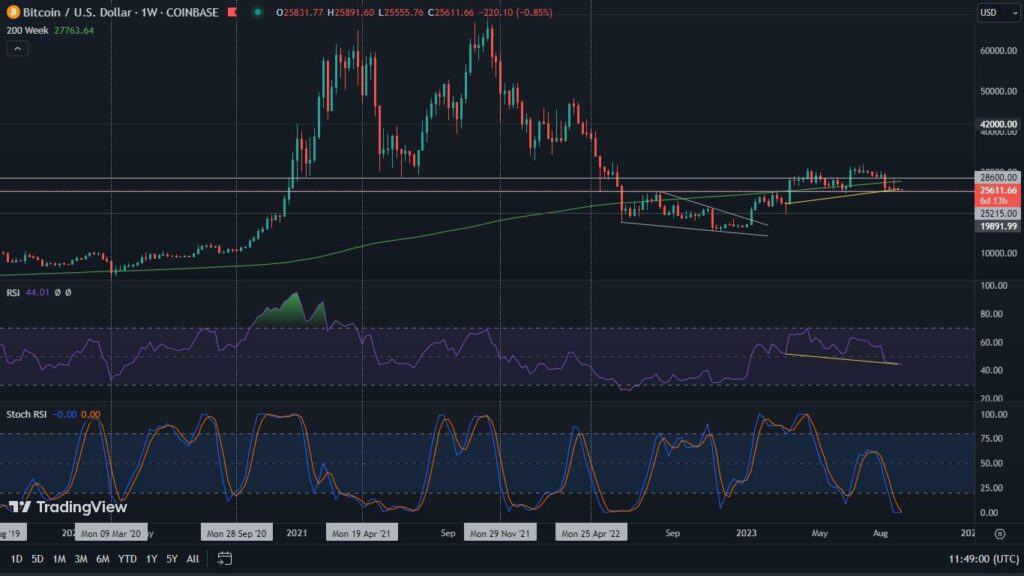
The structure of the weekly chart does not look the most favorable. On it we see four red candles in a row. The first one is clear and long, and the subsequent ones are much smaller. Such a picture usually results in another downward breakout attempt.
Instead, focusing solely on the effects of the past week, we can see that the value of Bitcoin fell by 0.5%. The RSI lowered its level to 44, which we know favors the bears. Both the 200-week SMA and the horizontal level of $28,600 play the role of resistances. It is interesting, however, that support at the level of $25,200 is still respected. Nevertheless, it was touched for the fourth consecutive time. Such a situation can be interpreted in two ways. On the one hand, Bitcoin is clearly defending it, while on the other hand, the frequency of its touches may indicate that it is weakening.
On the other hand, a positive aspect, leaving no doubt, is the clear bullish divergence of the RSI. It is also supported by the stochastic RSI, which has completely reset, reaching levels not seen for a very long time.
Bitcoin on the daily chart
The scenario that we have been pointing out as the most likely one in recent times has managed to come true. Bitcoin made a breakout of support at the level of $25,200 and recorded a decline to the value of $24,920. This was a classic false breakout, which deepened the bullish RSI divergence (dashed yellow line), ultimately resulting in a significant upward bounce.
At the moment, Bitcoin is struggling with a local bearish divergence (continuous yellow line). However, it is very easy to negate. In our opinion, attention is worth focusing near the 50-day moving average. On the chart it is represented as a red continuous line. It currently oscillates in the area of $27,500. This SMA has often acted as resistance. This situation may repeat itself. In addition, it is likely that once the value of Bitcoin reaches the aisle, a new and thus wider bearish divergence will be formed. The convergence of these factors has the right to strengthen local resistance. Volumes, meanwhile, remain healthy.
Possible declines, on the other hand, could lead to Bitcoin once again oscillating between $25,200 and $26,000. Recent lows will provide a new support level.

Bitcoin is experiencing a death cross – what’s next!
Meanwhile, on the daily time interval, Bitcoin experienced a death cross, taking place between the 50-day and 200-day SMA. This situation is not the first time this has happened. Because of this, we will look at its historical impact:
April 2015: -8% in 3 days, then +47% in 77 days,
September 2015: marking the bottom and +117% in 50 days,
March 2018: +46% in 36 days, then -68% in 225 days,
October 2019: +22% in 1 day, then -39% in 40 days,
March 2020: -13% in 3 days, then +72% in 40 days,
June 2021: -19% in 3 days, then +83% in 77 days,
January 2022: -64% in 310 days.
The above data clearly shows that the death cross scares only by its name. Indeed, it is difficult to draw any firm conclusions based on it. However, it is worth noting that it quite often pointed to the vicinity of the local bottom of the BTC price.


