

Bitcoin has fallen below $30,000! What’s next for the price of the leading cryptocurrency? We have a broad analysis for you, based on a lot of data from different segments. We will try to determine what can happen with BTC in the coming days and weeks.
Current situation on the Bitcoin chart
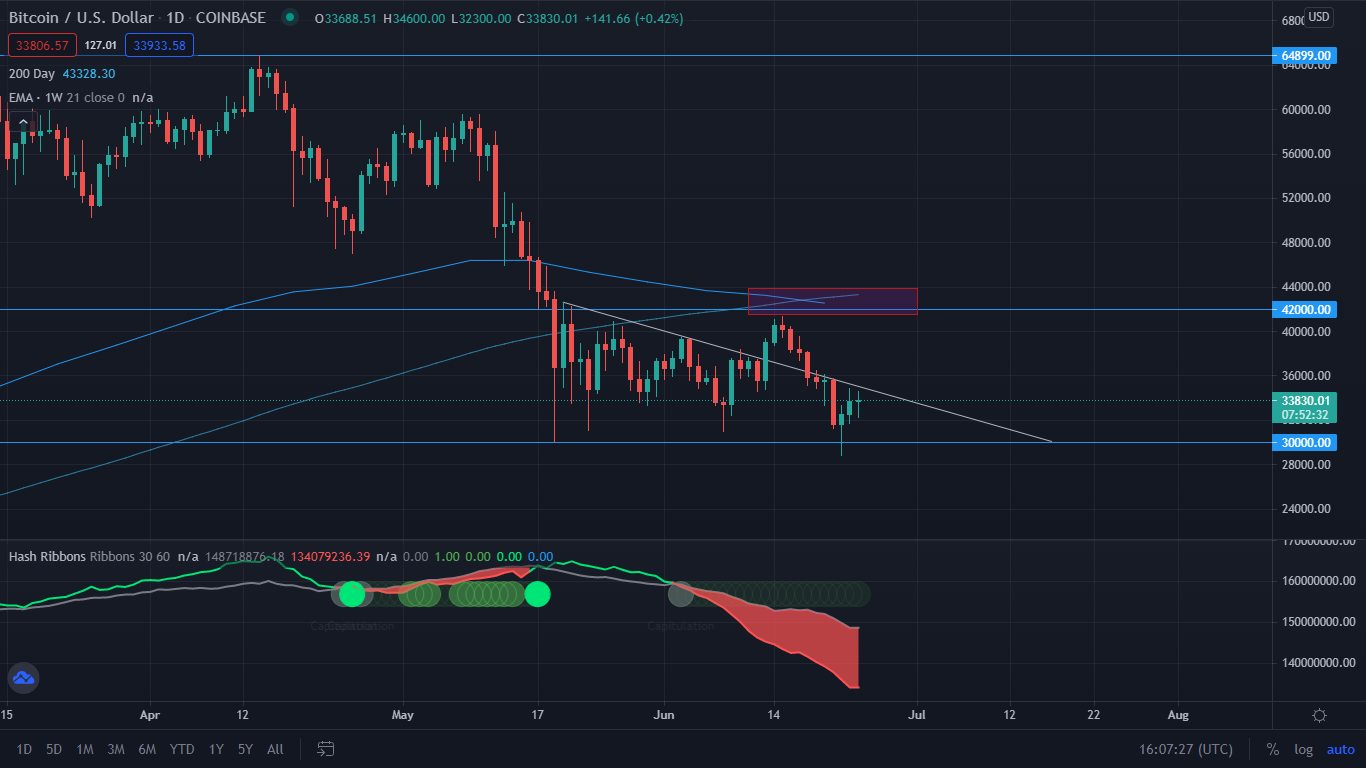
On May 19, the price of Bitcoin hit $30,000, noting this level for the first time since late January. Thus, the BTC/USD pair started a consolidation in the range of 30,000-42,000. The attempt to break out of the upper limit that took place on June 15 ended with a rejection. From a technical point of view, in the mentioned region one can observe the convergence of several factors that effectively acted on the market bears. This was the price resistance, and at the same time the presence of the 200-day moving average and the 21-week exponential moving average. We can see the full set of these factors in the purple rectangle marked on the chart. The rejection of this level triggered a downward rally in the price, which on June 22, went below $30,000 for a few hours, even reaching $28,800.
What is the reason for such sharp declines?
Recent times have undoubtedly been a period of difficult PR for Bitcoin. Positive news from Latin American countries is covered up by discussions about the energy consumed by the BTC network and the bans that keep coming from China. Miners there are forced to close their businesses, which makes the Hash Rate of the king of cryptocurrencies constantly fall. This can be observed, for example, on the Hash Ribbons indicator located at the bottom of the chart.
The market is shrinking, but strong hands are accumulating!
It is worth noting that the total capitalization of the cryptocurrency market has also been falling since May 12. Its ATH amounted to $2.77 trillion to record a peak of $1.13 trillion on June 22. This gives a total reduction of 56.3% in 41 days.

Importantly, the on-chain data points to Bitcoin’s accumulation by so-called strong hands. This fact is perfectly illustrated by a chart posted on Twitter by a leading anlite. In it, Willy Woo points to the flow of Bitcoin to investors who see a real opportunity in the current situation and who are considered long-term hodlers. Their portfolios are growing steadily. This means that the sell-off that occurred was due to new people in the market who purchased their coins over the past few months. As a result, they often sell at a loss.

What could happen in the coming time?
$30,000 seems like solid support. However, the frequency with which Bitcoin reaches this area may indicate that the bears will break through the bullish resistance and the Bitcoin price will dive a little deeper. The next support we can expect is the 2017 ATH area, which is around $20,000. However, we must admit that the probability of reaching this level is not very high. The data coming from the exchanges indicate a multitude of buy orders at the level of USD 25,000.
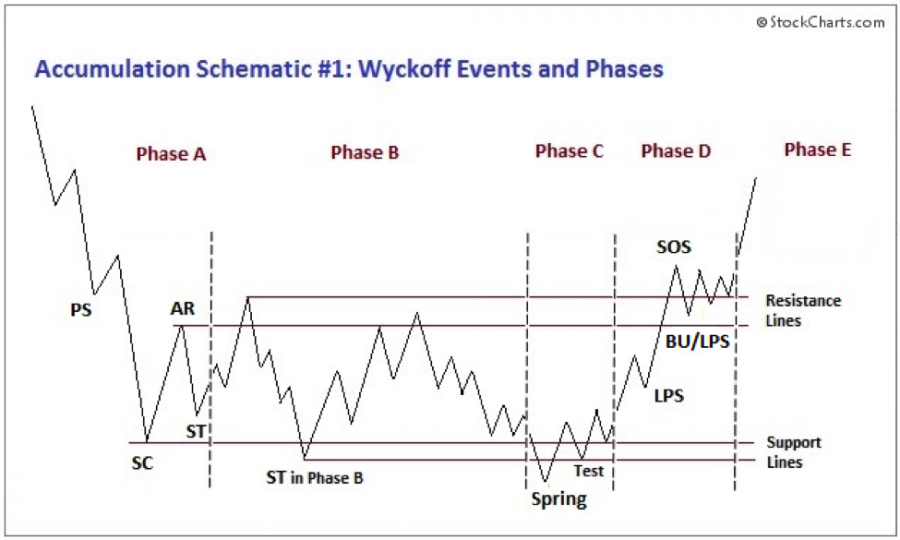
Recently, rhetoric has been quoted with increasing frequency indicating that bitcoin is in a time of accumulation, according to Wyckoff’s scheme. Market opinion is divided, but based on the chart below we can surmise that BTC is currently in “Phase B”. Following this pattern, we could once again expect the price to break below the bottom formed on June 22. If, on the other hand, we have the “Phase C” bottom behind us, we should expect the leading cryptocurrency to successfully break out of the resistance at the level of $42,000 and, confirming it from above by creating support, begin another phase of growth.
However, we should remember that before us is the holiday period, which historically has been a dormant time for Bitcoin. It is also worth keeping an eye on the Hash Ribbons indicator, which despite being a lagging factor, while giving a buy signal has already successfully informed us of the ending accumulation period many times. Considering the depth of its descent as shown in the first chart, we will most likely have to wait a few more weeks for this signal.


