The price of the leading cryptocurrency opens high above a key resistance level day after day. This is a clear confirmation that the recently observed breakout was not false. Should we therefore expect further upward movements?
Bitcoin on the weekly chart
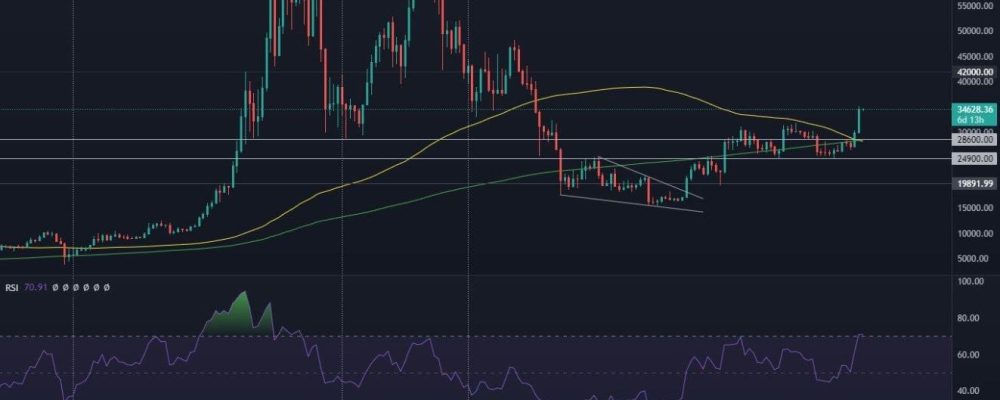
Another week and another impressive rise. This time Bitcoin rose as much as 15.1%, thus confirming a very significant breakout. We are talking about the resistance at $32,300, which for the moment is held as support on slightly lower time intervals. Nonetheless, the situation is cause for considerable optimism. The effect of the aforementioned price movements is that the RSI has climbed to the level of 70. And earlier we have repeatedly pointed out the bullish divergence of the RSI, which, as you can see, has contributed to the spikes observed recently.
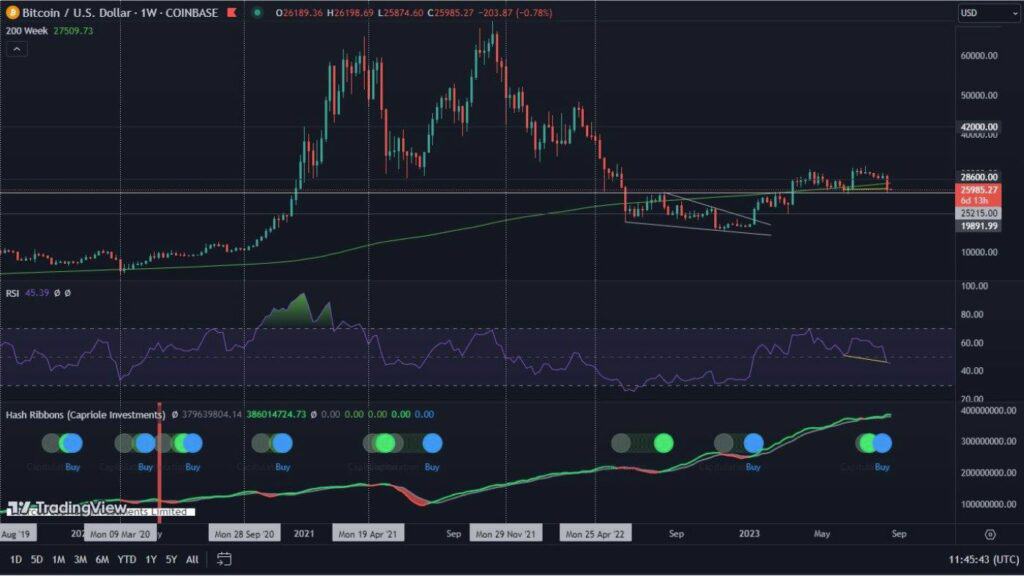
To cite any perspective, however, it is worth noting one somewhat disturbing factor. In the chart provided below, we have used two lines – yellow and green. They refer to the 100-week and 200-week moving averages, respectively. Unfortunately, at the moment there is a so-called bearish cross between them. On this interval this is an extremely rare phenomenon. Therefore, it is difficult to clearly relate it to historical events. However, we should remember that the intersections of moving averages are so-called lagging indicators. Consequently, excessive attention to them can be misleading.
Bitcoin on a daily chart
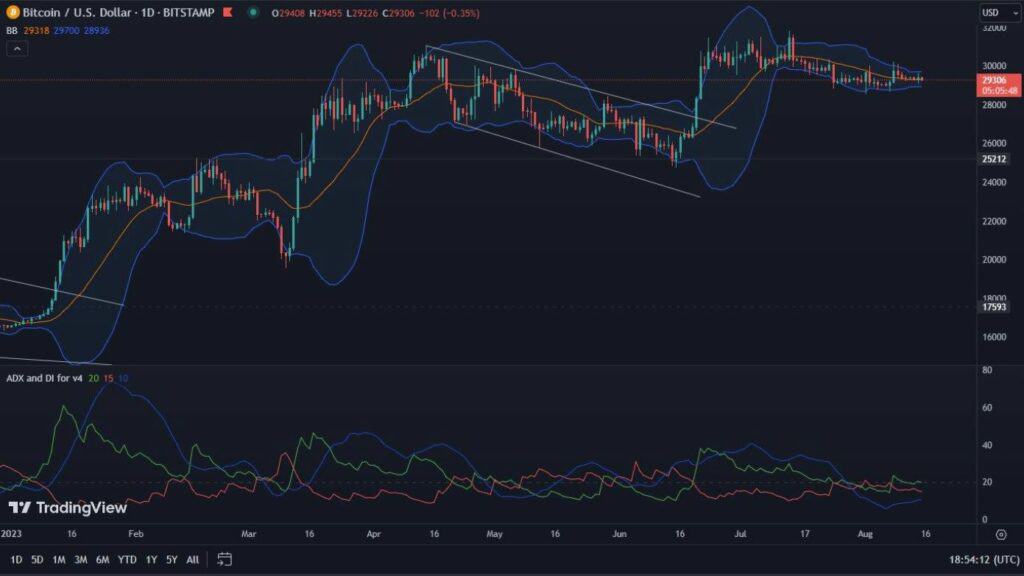
In contrast, a completely different situation in terms of moving averages is presented by the daily chart. This is because here as many as two bullish crosses occur simultaneously. The first is noticeable between the 50-day SMA (red line) and the 100-day SMA (yellow line). The second, on the other hand, between the 100-day SMA and the 200-day SMA (green line).
As we mentioned in the case of the weekly chart, so we will also point out here – moving averages are lagging indicators. This means that the reaction to their occurrence can be erratic. Especially when a number of bearish factors occur at the same time. Such, unfortunately, are currently taking place.
The first of these is the ADX, which indicates the strength of the trend. It is undoubtedly high. Nevertheless, almost every time the ADX exceeds the value of 70, Bitcoin reaches a local peak. Unfortunately, a similar situation is currently taking place. Moreover, counting successive candles, one can see that TD Sequential is highly overvalued and indicates a possible correction, or consolidation. Thus, declines may result in a visit to the price levels around $32,300. Here we are looking at potential strong support. If the expected reaction occurs at this level, and there are many indications of this, the continuation of increases should remain only a matter of time.
Bitcoin’s dominance keeps the trend going
Bitcoin is rising, but altcoins seem to be lagging far behind. Many of them are losing significantly to the king of cryptocurrencies, which does not inspire optimism. On the other hand, however, the graph of BTC’s dominance has not been so clear for a long time. Currently, two lines are worth watching. One is the potential horizontal resistance of 57.2%, and the other is the uptrend line, which is highly respected by Bitcoin. If the indicated resistance works and the trend is broken, altcoins have a chance to shoot up. For this to happen, however, it may still take some time.

