Bitcoin’s very low price volatility causes the market to start ignoring it. It is moments like this that have historically been the vestibule for significant movements of the leading cryptocurrency. In the meantime, key support still remains in play. Does it represent a local bottom and the ultimate bounce point?
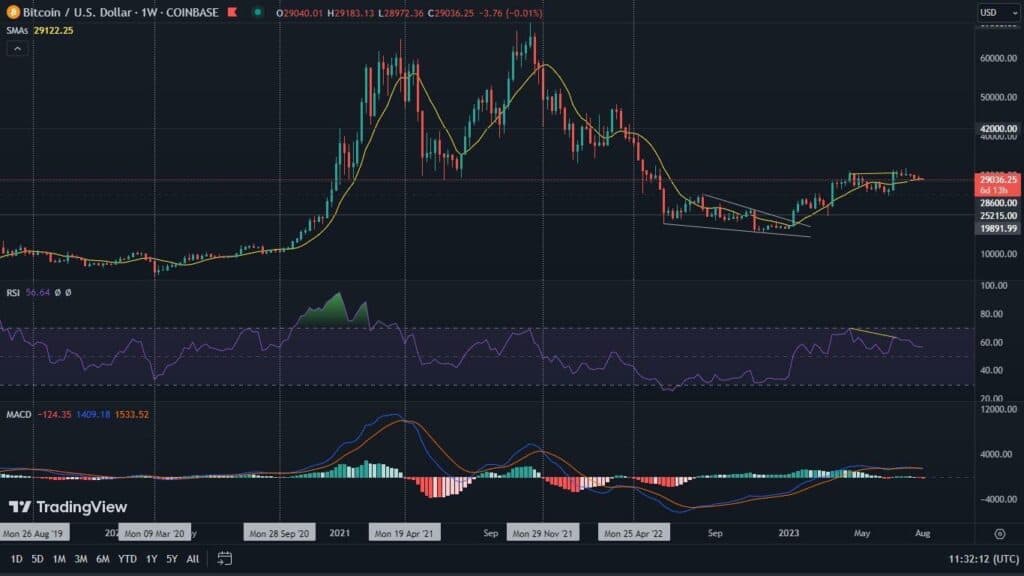
Bitcoin on the weekly chart
Looking at the weekly chart of Bitcoin, it is difficult to talk about stunning results. Not only that – in this silence resulting from negligible volatility, very contradictory signals are beginning to appear.
Thus, the past week ended with a 0.8% decline in the value of BTC. RSI maintains its local bearish divergence. The MACD, on the other hand, is a cause for concern. This indicator has looked very indecisive for a long time, constantly changing its momentum. A few weeks ago, we reported on the bearish cross that was drawn on it. Later, a bullish cross appeared, only to be negated now, creating another bearish reaction. This is a definite blot on the condition of the weekly chart, which, this fact aside, still looks very favorable.
For it is worth noting that the RSI, maintains its value at 56, which definitely favors the bulls. In view of this fact, the price defends the support defined by the 10-week moving average.
Bitcoin on the daily chart – a game of correlation
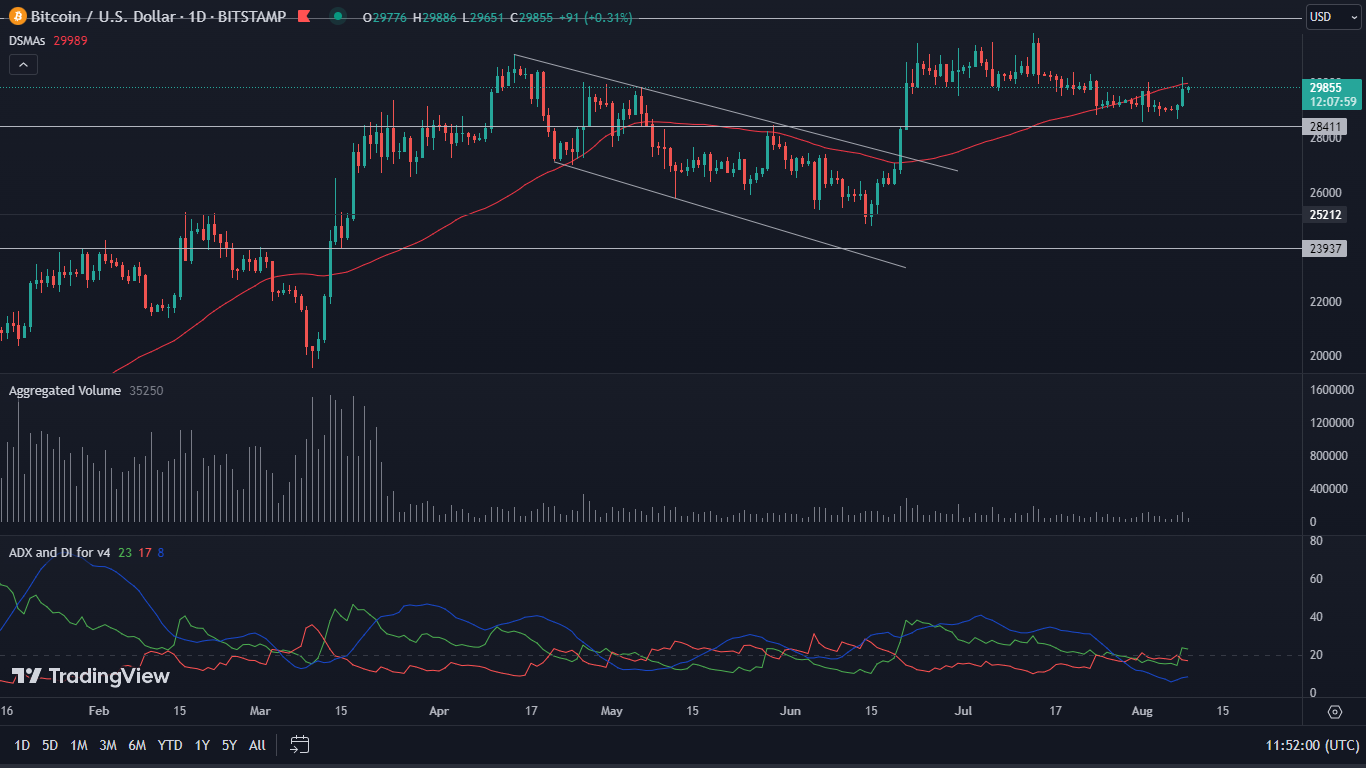
We decided to divide the analysis of the daily chart this time into two segments. The first is the support zones, which are gaining ground thanks to bullish indicators. The second segment will mainly represent resistances and possible opportunities for further price movement.
On the BTC chart, we are seeing a very clear reaction to the horizontal support located around $28,600. This is also where the 100-day moving average is located. We have been reporting on the confluence of these two factors for a long time. We predicted that Bitcoin’s reaction to the area was almost a necessity. For the time being, this is also happening. In doing so, the rebound is supported by a very clear RSI divergence, as well as MACD, which has made a bullish cross.

The current rebound has encountered obvious resistance, which also represents a kind of correlation. It occurs between the 50-day moving average and the psychological limit of $30,000. This horizontal level has, over the past two months, on more than one occasion, been an important bounce point. It therefore promises to be a struggle to overcome it. For this to become a reality, increased volume should be expected.
On the other hand, it is interesting to note the ADX indicator, which fell to an unprecedented level since April 2020, at 6. In this case, it absolutely does not suggest the direction of the movement, but nevertheless makes it clear that this one is coming.
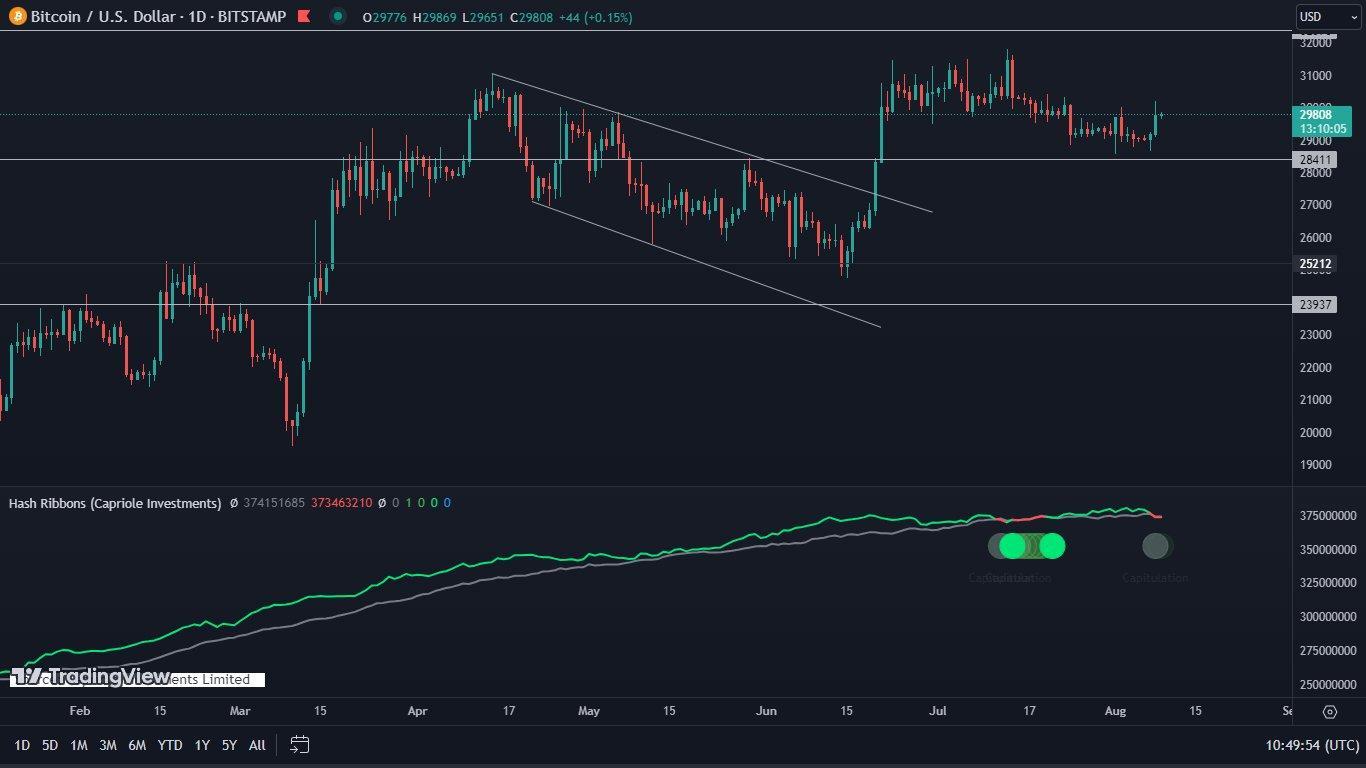
Hash Ribbons capitulation zone
We have also been watching the Hash Ribbons indicator for a long time, expecting a buying signal on it. However, this one has not appeared. To make matters worse, the indicator, despite its earlier exit to a “healthy area,” has again found itself in the capitulation zone. This means that most of Bitcoin’s mines are now in distress, which may suggest selling pressure.
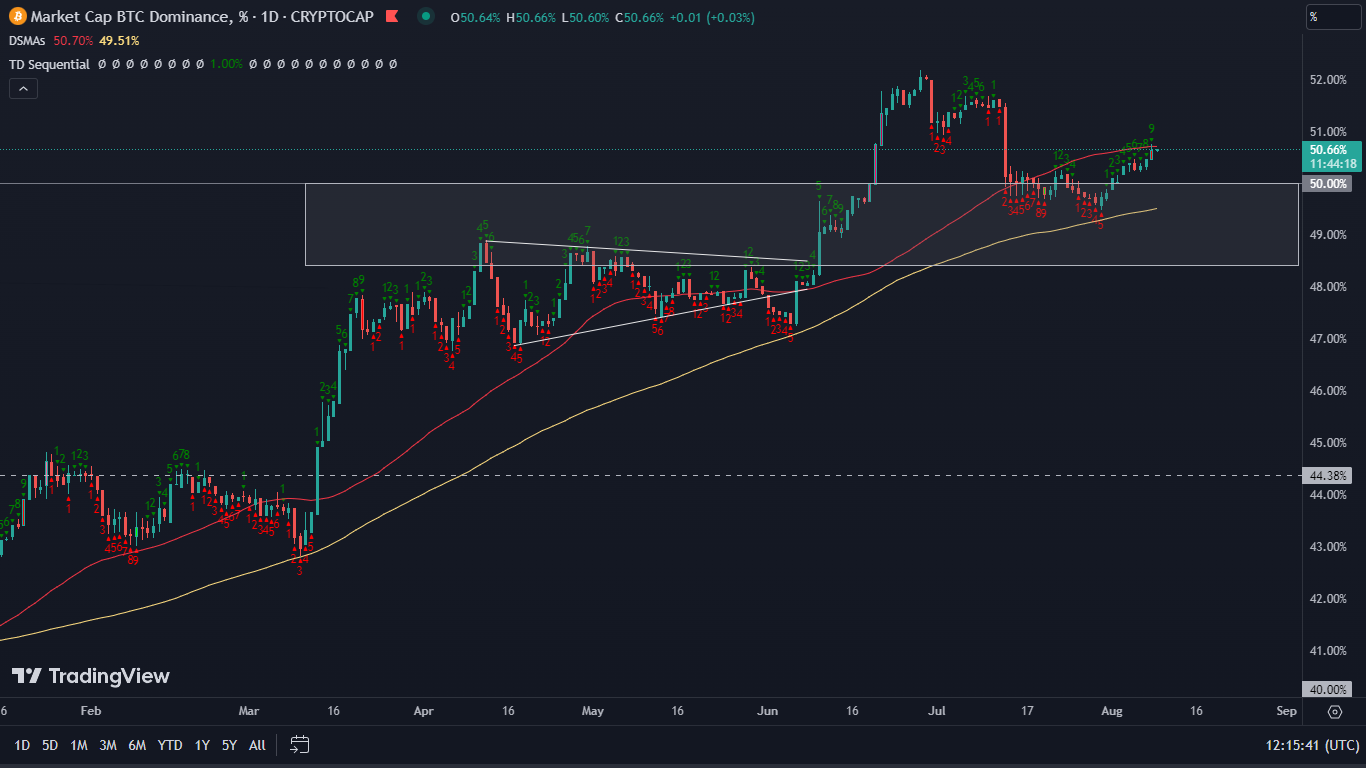
Is this another opportunity for altcoins?
Bitcoin’s dominance seems to be a carbon copy of BTC’s chart against the dollar. Here, too, we see a tightening of the action between the 100-day and 50-day moving averages. The former is support, the latter may currently be resistance. This scenario is supported by the TD Sequential, which indicates the ninth upward candle in a row. This is a potential turning point. Thus, an opportunity is drawn in front of altcoins.