

Since the beginning of the year, Bitcoin has recorded a price jump of 41.5%. Meanwhile, the leading on-chain metrics confirm the end of capitulation. However, there are also concerns. Let’s take a look at the details!
Bitcoin on the weekly chart
Despite the solid jump in price, the weekly chart has much less to tell us than it did on previous occasions. Nevertheless, we note on it an 8.8% increase in the value of BTC. This movement is supported by increased volume, which is a very healthy signal. In addition, BTC managed to rise above the 55 level on the RSI indicator. This area has historically provided support for the cryptocurrency. In the meantime, the first very significant pro-decline signal appears. It relates again to the RSI indicator and illustrates a broad bearish divergence. Nevertheless, it may expand further.
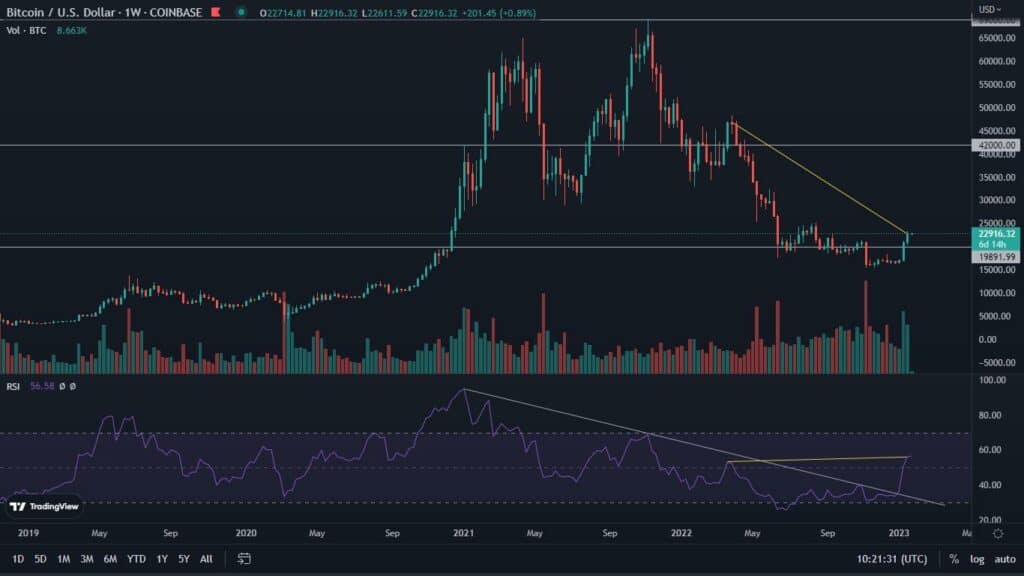
Another important factor of the weekly chart, is the upcoming death cross between the 50-week and 200-week SMA. This is definitely an unprecedented event. A similar one may have occurred in late November and early December 2015. However, the bulls showed enough strength at that time to avoid it. Due to the lack of history of such events, it is almost impossible to assess the potential impact. Meanwhile, the intersection of these moving averages could occur as early as this coming week.

Bitcoin on the daily chart
In the previous analysis, we pointed out the market’s predilection for parallel formations and thus delineated a potential scenario for further movements. At that time, we marked with yellow lines a descending channel, the possible presence of which could satisfy both bulls and bears. Seven days later, these scenarios are still in play. Moreover, the local reaction to the channel has been confirmed. The Bitcoin price has attempted to overcome it for the last four days in a row, not once closing the session above its boundary. Thus, a pullback towards the CME gap, located in the range of $19,550 and $20,980, and a further upward bounce is still in play. At the same time, we are seeing weakening volumes. However, given that BTC is in a short-term consolidation, such a situation is justified.

In the meantime, we observe a clear bearish RSI divergence. On the chart we have marked this local one, located in the overbought zone. Nevertheless, looking more broadly, we can see an even larger one, also suggesting declines. It is also worth noting the ADX indicator. It has exceeded the level of 70, which in turn may mean that the local top of the trend lasting for almost a month is being formed.

Key on-chain metrics suggest end of capitulation period
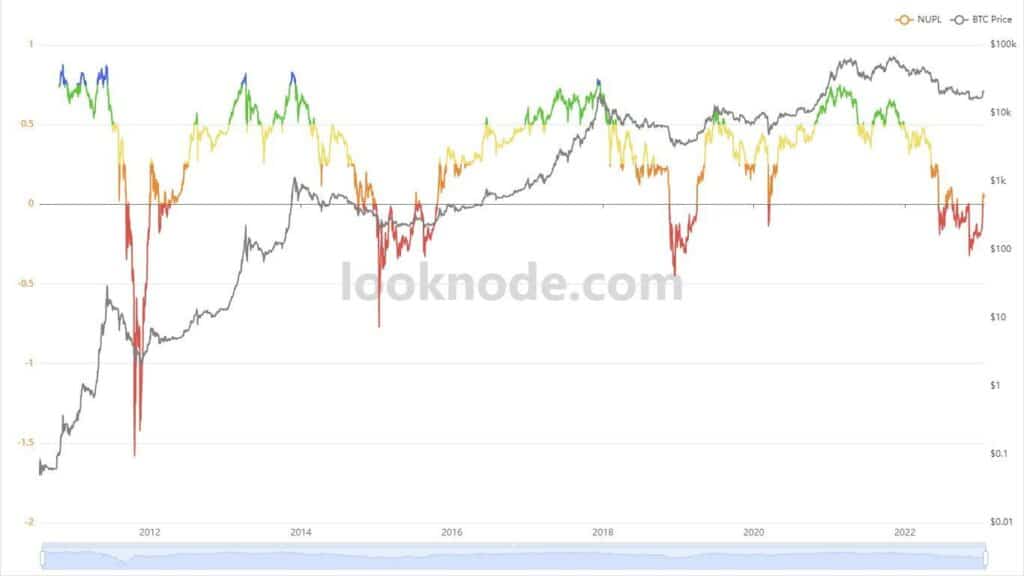
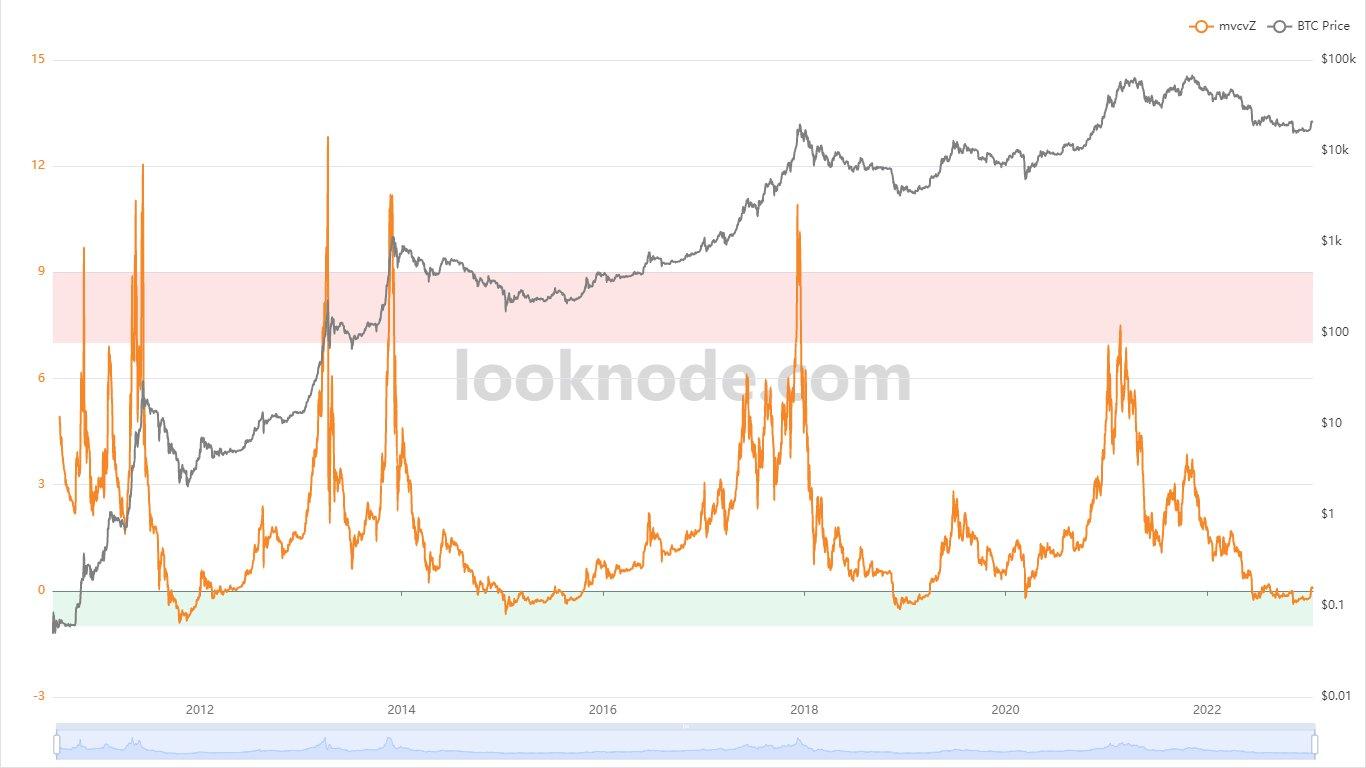
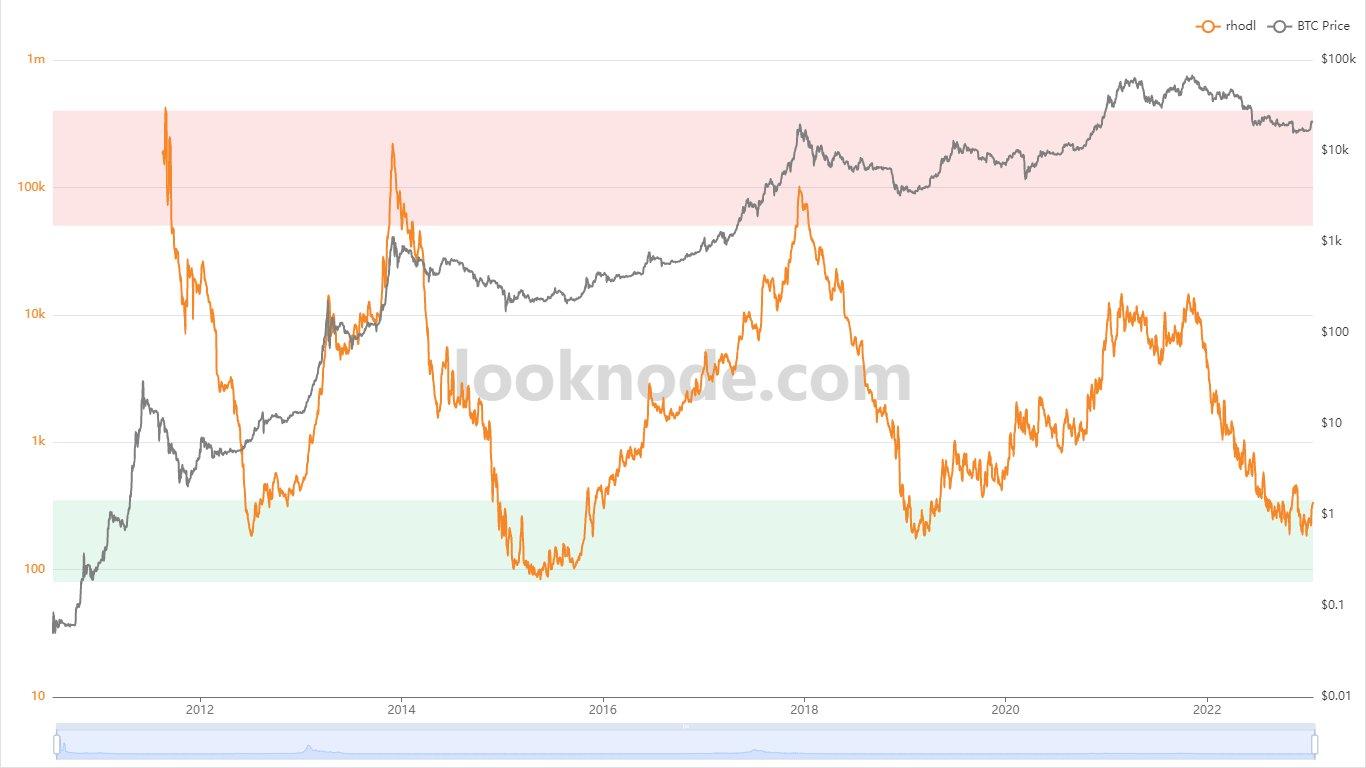
Using the data provided by Looknode.com, we can draw some very interesting conclusions. First of all, it is worth noting three key on-chain metrics that suggest that Bitcoin, its period of final capitulation, may be over. These are Net Unrealized Profit/Loss (NUPL), Puell Multiple and MVRV Z-Score. In addition, the fourth metric, known as the RHODL Ratio, is very close to following suit. For the market, this is definitely a good signal.

What is driving the Bitcoin price increases?
One of the key questions worth asking is what is driving the current increases in the value of Bitcoin, as well as the cryptocurrency market as a whole. Here again, Looknode.com data comes to our aid. The metric presented, however, is cause for concern. After all, it turns out that previous BTC rallies, correlated with an increase in the total amount of stablecoins in circulation. This time, however, this is not the case. This suggests that the ongoing movements are caused by the internal flow of capital that, in the form of stablecoins, has long been in the market. It is therefore worth watching this indicator. For the rally to continue, its positive reaction seems essential.


