Last week we pointed out that Bitcoin was reaching a very clear zone, the breakthrough of which would determine its further future. This resistance proved to be too strong, resulting in the declines currently being watched. Where is the price currently headed and should a new low be expected?
Bitcoin on the weekly chart
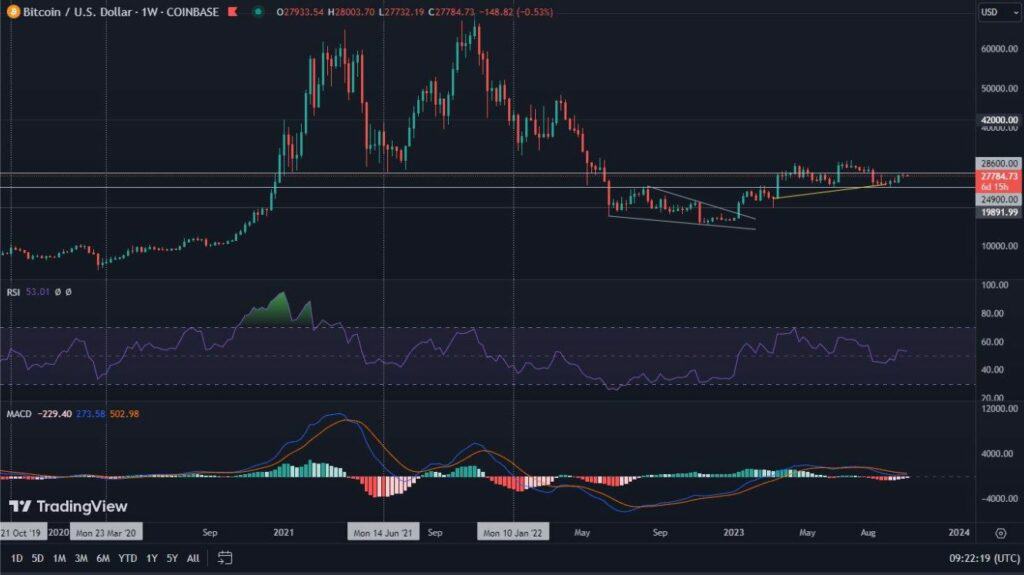
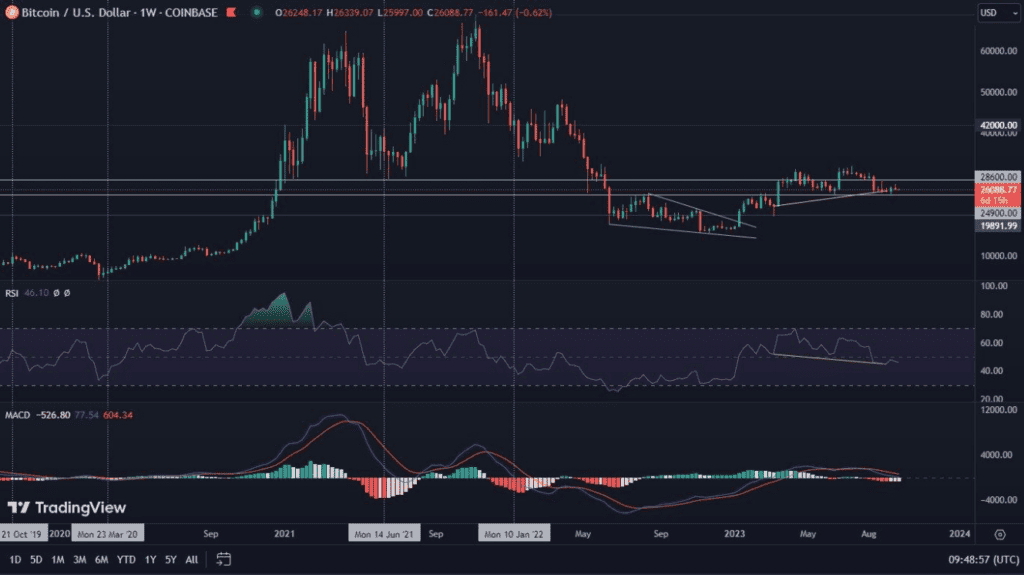
While in the past week, Bitcoin on the weekly interval gave a seemingly dull impression, there is a lot going on at the moment. Let’s start with the fact that the leading cryptocurrency has lost 2.00% in value. Looking at the construction of the candle drawn on this occasion, we can clearly see that it suggests a continuation of the downward movement. A very negative signal is also the fact that in the last seven weeks, Bitcoin has twice rejected the RSI resistance, under which it has been exactly for 100 weeks. Although it is not visible now, in the middle of the past week, the RSI clearly pierced the downward trend line forming this resistance. However, with the passage of time, it once again found itself below it. With price action played out in this way, we can clearly see that the bullish RSI divergence is beginning to weaken. The bullish wedge, however, still remains in play. In remarkably good shape, on the other hand, is the MACD, which continues to maintain bullish momentum.
This type of price action supports the prediction we undertook in the previous analysis. According to them, Bitcoin may be heading towards the formation of an RSI divergence, which would be fully positioned in the oversold zone. Such a situation would have the right to indicate the final bounce point of BTC. However, it may involve the formation of a new bottom.
Bitcoin on the daily chart
Meanwhile, the daily chart indicates what we pointed out in the introduction to our analysis. On it, we are dealing with a clear zone (gray rectangle), the breakthrough of which was crucial to sustain the increases and to finally form a consolidation around $20,000. This goal was not achieved. Moreover, the aforementioned zone, through the characteristics of the price action, has become even stronger resistance than it was before.
This is evidenced by the clear rejections that took place in its upper part, as well as two days later, in the lower part. The RSI divergence, which we have long mentioned, is also losing momentum. As on the weekly interval, we expect it to stretch out here as well. On the one-day chart, this could result in as much as a third decline to the oversold zone. In the meantime, we are watching the MACD, which is looking for the direction of movement. A few days ago, we saw a bearish cross on the indicator, but the very next day, the downward force weakened significantly. This suggests a local consolidation. As for the extent of the movement, it is worth watching the behavior of the price around the designated wedge.
Bitcoin’s dominance is growing
It is worth noting the chart of Bitcoin’s dominance. On it we can see that the leading cryptocurrency is gaining strength over altcoins. Keeping in mind that altcoins are also stablecoins, this could indicate a flight of capital from the cryptocurrency market. The uncertainty surrounding ventures such as Grayscale and Binance is undoubtedly having an impact on this. Aside from the weakening MACD, the chart does not show any particular anomalies. This may suggest that a similar lull could last longer.

