The news, regarding the SEC’s approval of the Bitcoin ETF fund, caused rapid price increases. However, this was false news, resulting in equally rapid declines. However, Bitcoin managed to hold on to some of its gains. In doing so, it breached extremely important resistances, which allow us to look at the chart with more optimism.
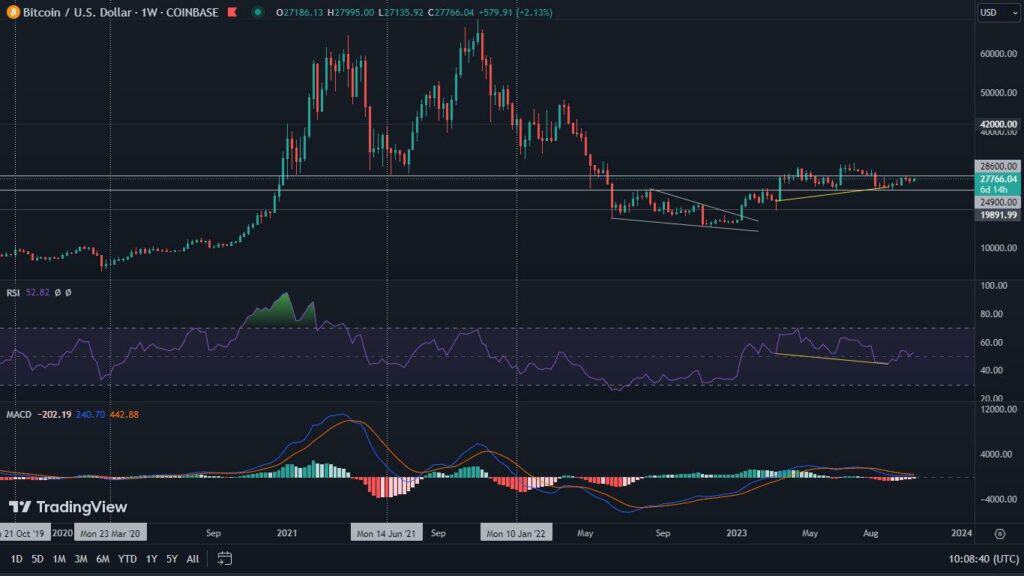
Bitcoin on the weekly chart
The facts presented in the introduction to our analysis took place on Monday, and this means that they did not affect the shape of the weekly candle, the closing of which took place on Sunday.
Thus, bitcoin lost 2.7% of its value. The RSI fell to the 50 level, which is the limit of bullish territory, an area that is generally strongly defended. The indicator is constantly accompanied by a bullish divergence. The whole is complemented by the MACD, which nevertheless continues to maintain a bullish momentum.
At the same time, the distribution of key moving averages looks very interesting. These, however, do not look promising. Well, there is a situation in which the 100-week SMA (yellow line), coincides with the 200-week SMA (green line). Not only do they form a bearish cross, but they also do so in the area of horizontal resistance, which is $28,600.
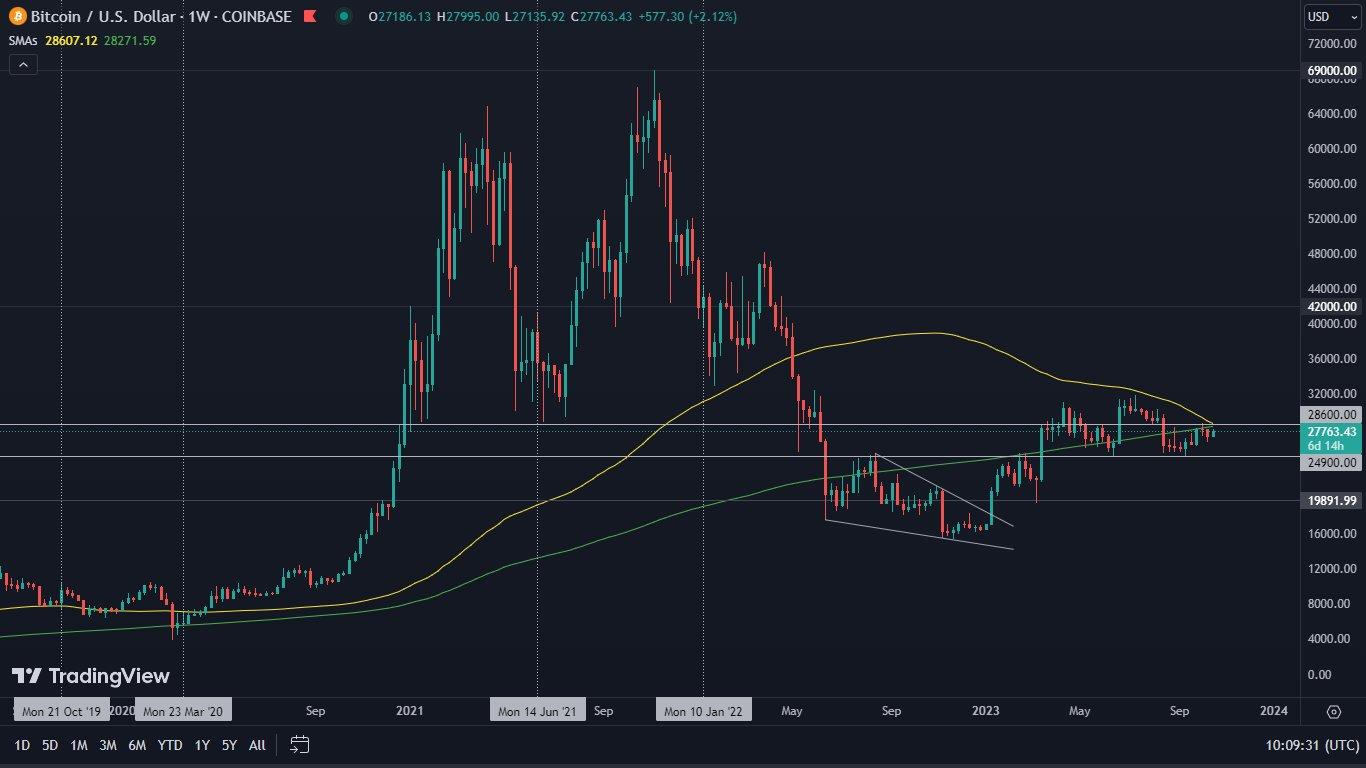
This is therefore a clear warning signal that is difficult to ignore. In addition to the aforementioned resistance, it is also worth looking in the direction of support. These, in turn, are shaped invariably at the level of $24,900.
Bitcoin on the daily chart
Staying on the topic of support, in the analysis published a week ago, we paid particular attention to another potential level of it, which manifests itself on the daily chart of Bitcoin. This was, of course, the 50-day moving average (red line). The strength of this level was greatly emphasized by the bullish RSI divergence.
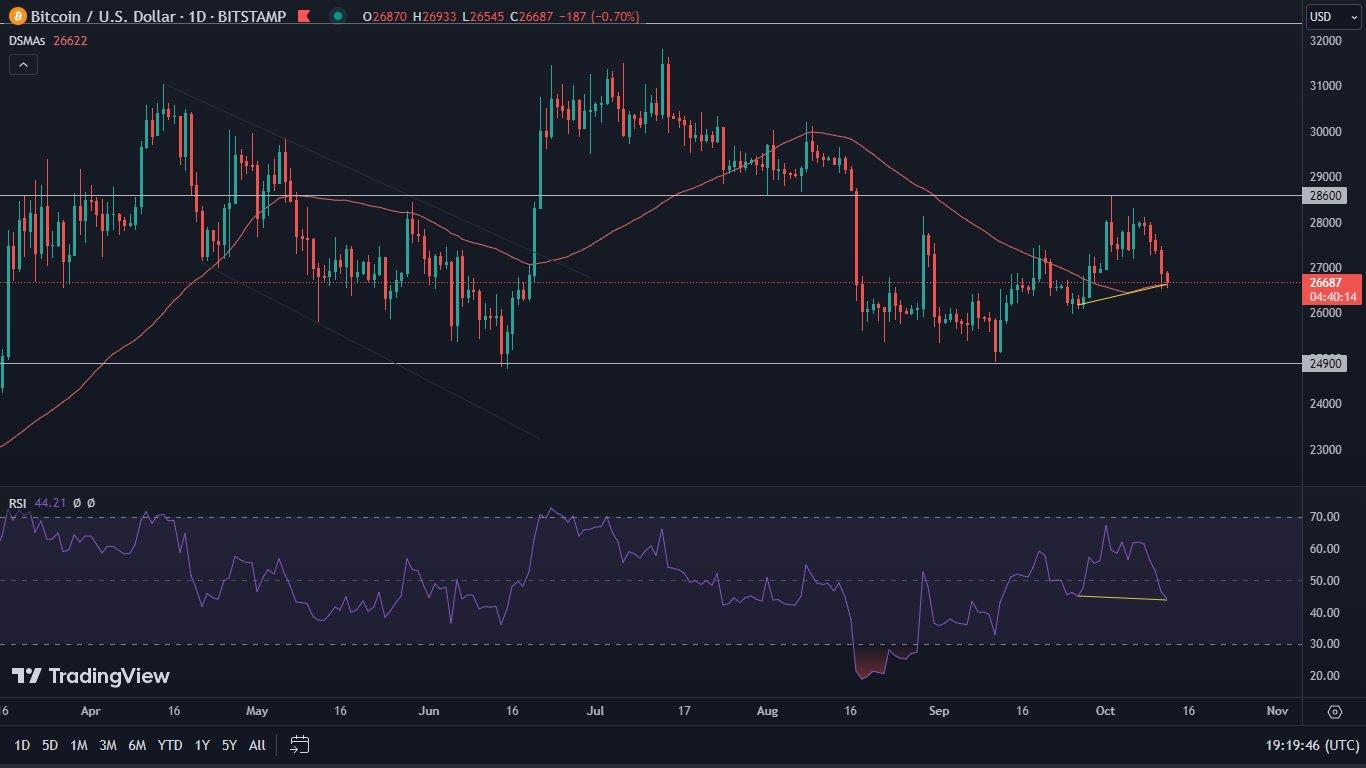
As it turned out later, it was in this area, accompanied by these indicators, that the first reaction occurred. Bitcoin shot up, at its peak reaching almost $30,000. In doing so, it broke through a series of extremely important resistances. The first of these was the 100-day SMA (yellow line). The second, on the other hand, was the 200-day SMA (green line).
The horizontal resistance of $28,600 was also violated by force. Maintaining all the aforementioned levels, could have resulted in a continuation of the movement. However, this has not happened. The price is currently oscillating above the moving averages, but the horizontal resistance proved too strong for a long-term breakout.
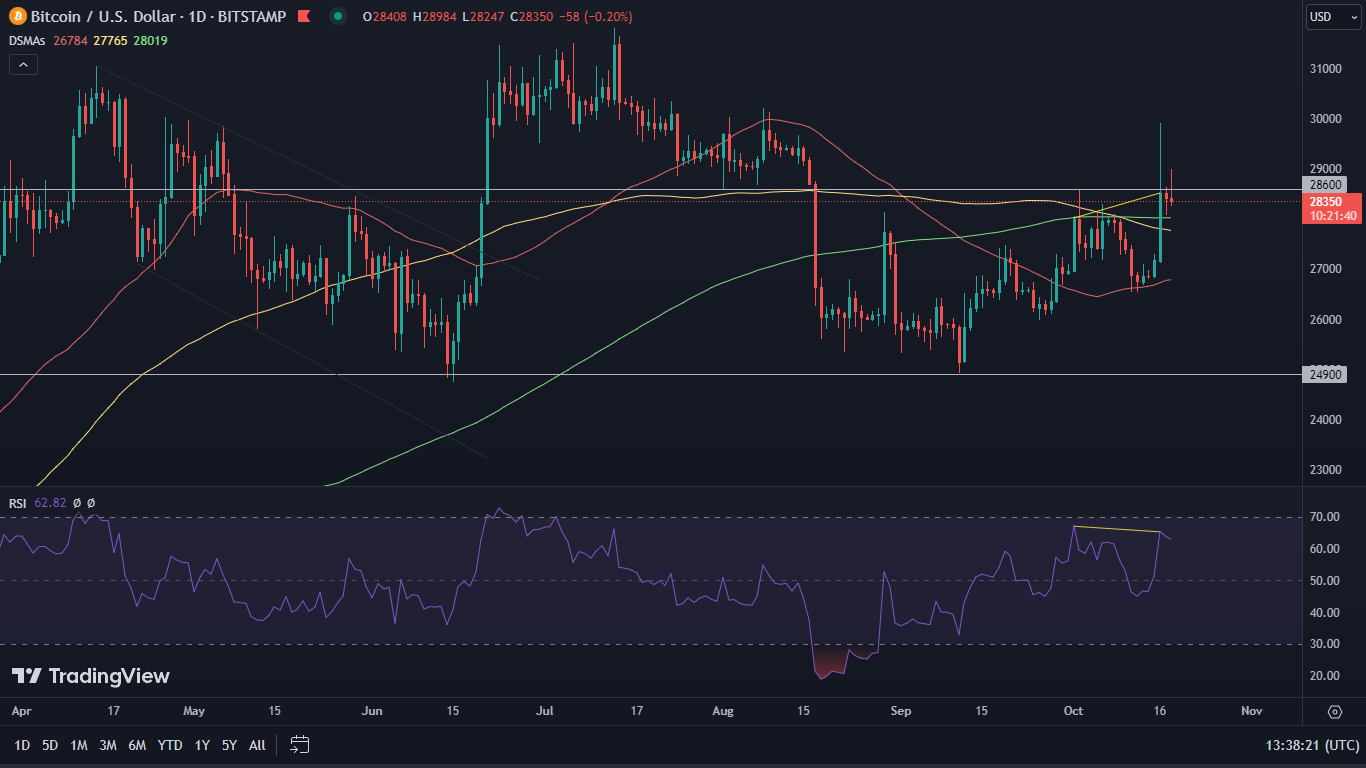
In this case, declines, or a possible consolidation, seem much more likely than increases. Also in their favor is the bearish RSI divergence. Yet it is worth remembering that it is small, and therefore relatively easy to negate.
On the other hand, a positive aspect of the presented Bitcoin price action is the presence of the long green wick of Monday’s candle. Although it indicates a rejection of important levels, the dynamics of the movement suggest that once demand sets in, the BTC price could be pushed to much higher values in no time than we are currently seeing.
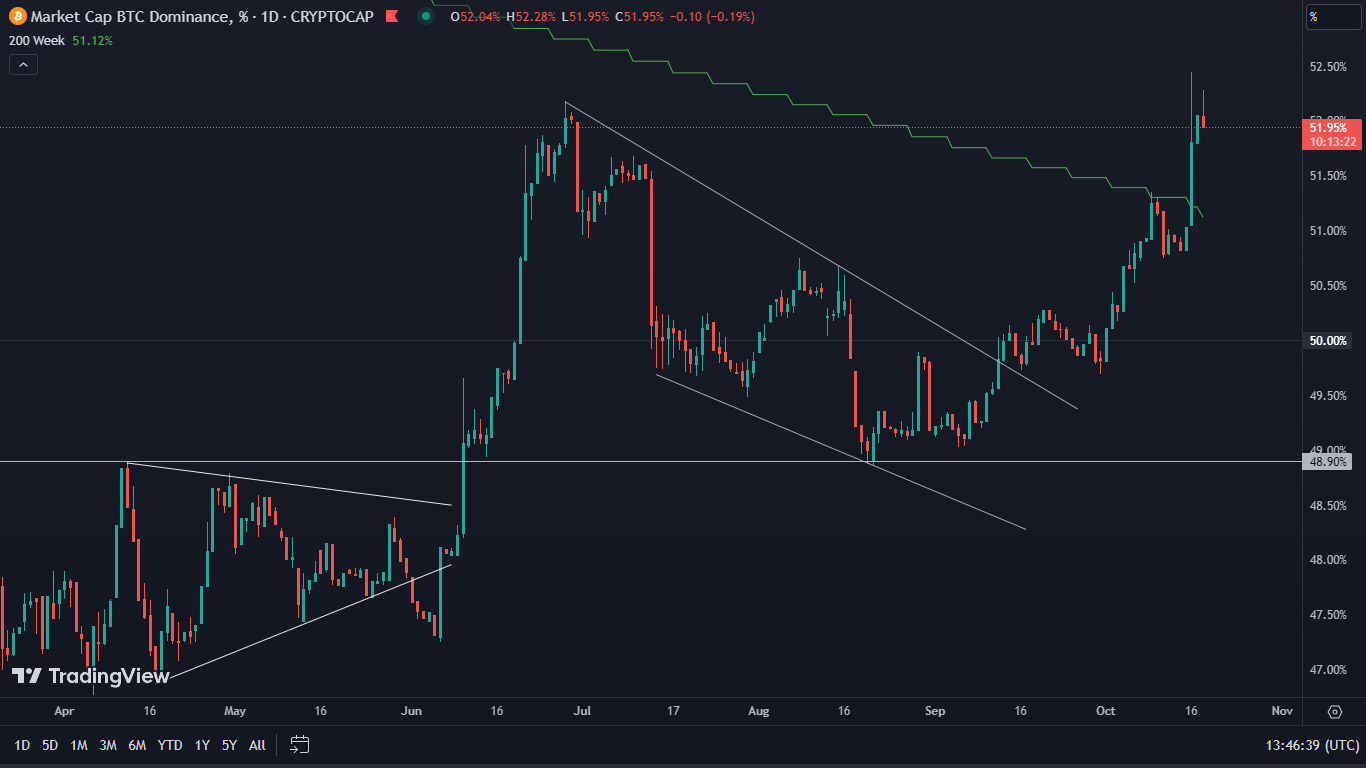
Bitcoin continues to control the market
The 200-week SMA on BTC’s dominance chart has been broken. The leading cryptocurrency did not take long to overcome it. This means that altcoins are steadily losing ground to Bitcoin, and even worse, these losses may continue to accelerate.