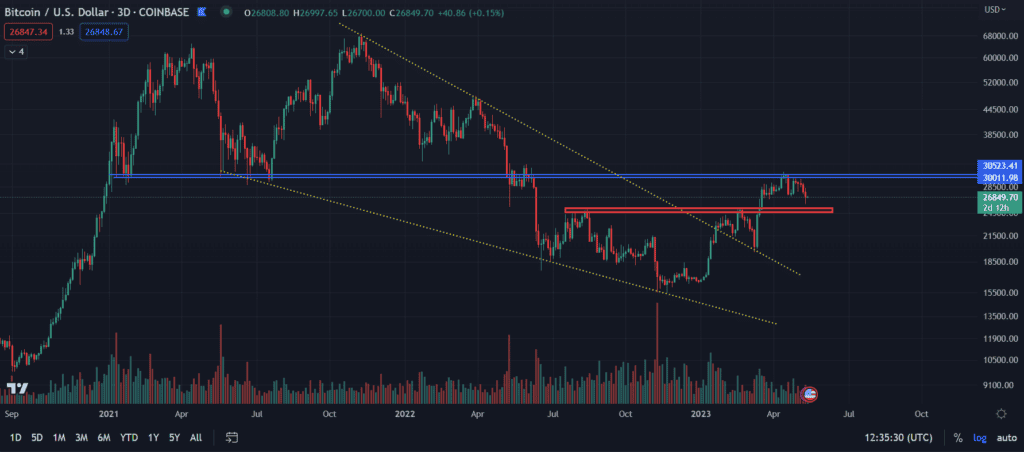
For almost a full four days, Bitcoin’s price opened and closed in a range narrower than 1%. While the market was expecting more volatility, this has so far not happened. However, there are many indications that it is only a matter of time.
Bitcoin on the weekly chart
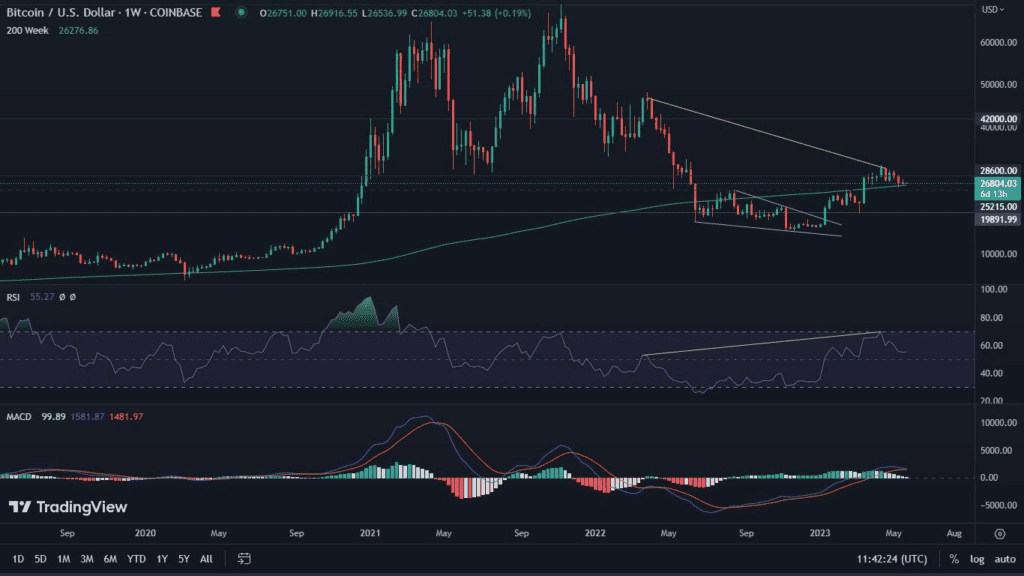
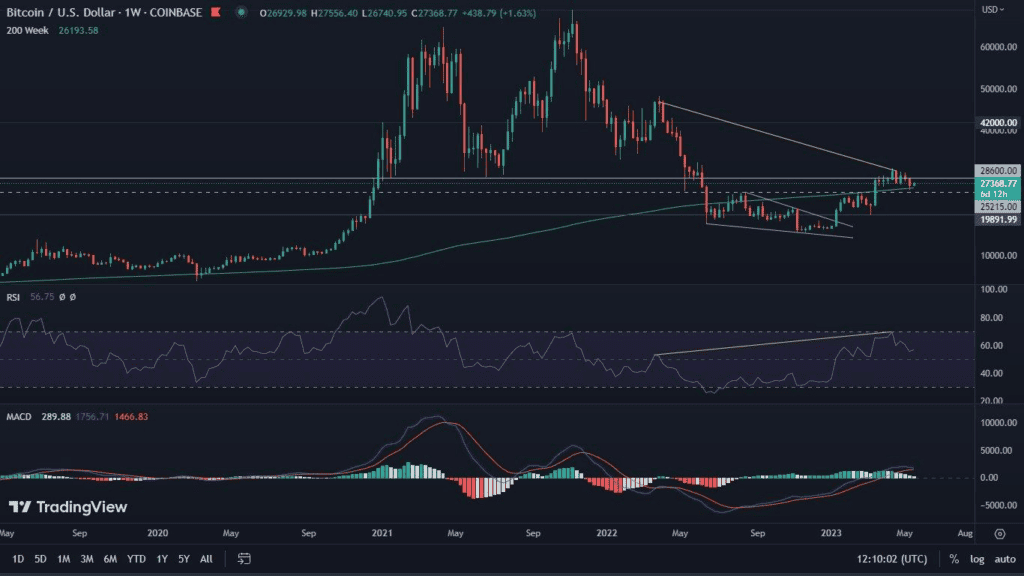
The situation on the weekly chart for BTC does not look the most favorable. After rejecting the horizontal resistance at the level of $25,200 and the 200-week moving average located there, it was time for deeper declines. The result was that the price of Bitcoin dived another 4.8%. It is accompanied by a bearish RSI divergence, which, moreover, is still likely to extend. MACD on the histogram confirmed the bearish momentum. In addition, the stochastic RSI is once again attempting to make a bearish cross and head downward. Opposing these factors is only the value of the RSI itself, which stubbornly remains above the level of 50. This area is important because it is the boundary between bullish and bearish territory. Remaining above 50 gives the indicator a chance for growth. Loss of this level is a risk of deeper declines.
Bitcoin on the daily chart
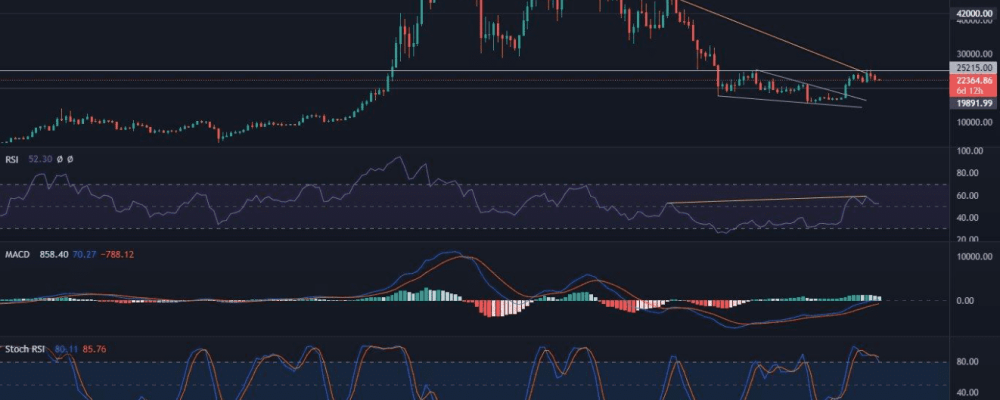
Nothing less is happening on the daily chart. Interestingly, here there is even a plethora of bullish signs. The price of the leading cryptocurrency is trying to defend the local uptrend line. It is accompanied by a bullish RSI divergence, also supported by the MACD, which is trying to catch bullish momentum. The stochastic RSI is also suffering from oversold, which may suggest a rebound.
Unfortunately, all of the above indicators are very easy to deny. A slide of the price by another 2% from current levels will cause the RSI to lose its bullish divergence. It will be easy for the MACD to then change to a bearish narrative. Thus, it seems that this is a key area for the bulls. If they do not come to the fore now, we will have to wait until the area around $21,350 for their reaction. This is where the next horizontal support is located. On the other hand, denial of declines could result in another attack to the $25,200 area.
Bitcoin’s dominance also in consolidation
The price is consolidating, and with it Bitcoin’s dominance. Although BTC is still in a relatively safe area and moving sideways within it, altcoins are not able to come to the fore. It is the movement of Bitcoin that the market is currently waiting for, and based on it will decide what will happen next with the flow of capital.
Thus, on the chart we see a narrowing potential triangle. It has not been confirmed, so for the time being we are not yet marking it. Nevertheless, accumulation continues just below resistance. It is accompanied by a MACD with bullish momentum, which could allow BTC to make another dynamic upward move.
Eyes turned towards the SPX
The eyes of the entire cryptocurrency market are watching not only what is happening to the price of Bitcoin, but also to the health of the SPX index. This one, despite currently trading above the downtrend line, lacks the strength for a solid rebound. In the context of the growing strength of the U.S. dollar, and with the announcement of further and still strong interest rate hikes, this is definitely a negative sign.

