

Consolidation usually comes before a further breakout, but does distribution come before a deeper correction? This is the question most market analysts are trying to answer, including us. With the help of indicators, we investigate what is currently happening on the Bitcoin chart and what we can expect in the near future.
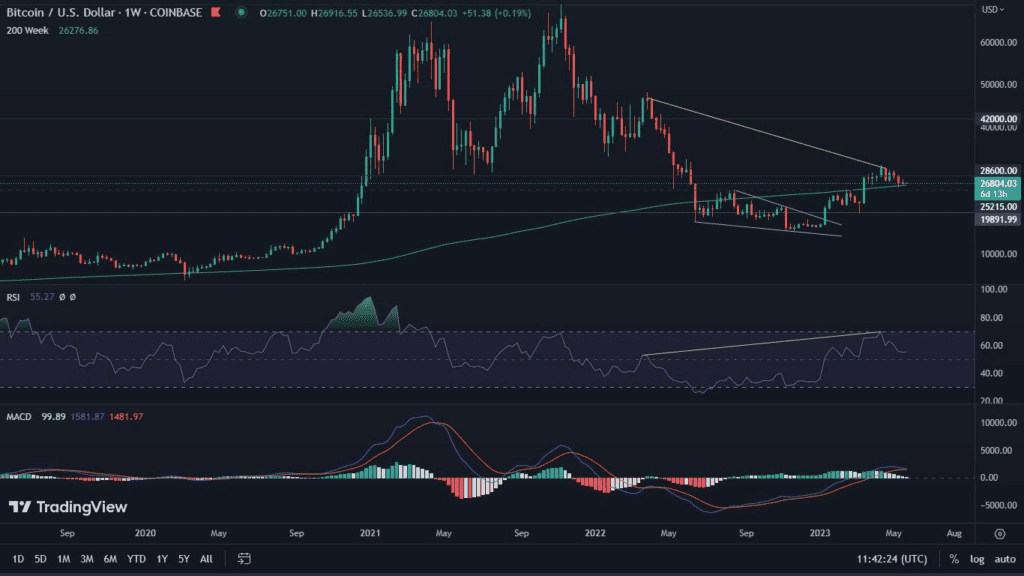
Bitcoin on the weekly chart
Compared to last week, Bitcoin only lost 0.7% in value. Despite the passage of time, the price action continues to trigger a bearish RSI divergence, which, moreover, may continue to widen. The MACD is showing bearish momentum for the fifth consecutive time. This indicator is behaving in a particularly interesting way. Until recently, it was about the least authoritative.
Today, however, it is clearly moving toward a bearish cross, which is entitled to happen in the next two weeks. The previous time such an event occurred was in August of last year. Currently, therefore, there is one of the longest periods in BTC’s history in which the MACD remains in the “green area.” When the intersection occurs, we will discuss in detail the history of such events and their impact on the price of the cryptocurrency.
On the other hand, the positive aspects that we observe on the chart are the maintenance of the price above the 200-week moving average, as well as the RSI, which is still above the value of 55.
Bitcoin on the daily chart
Has much changed on the Bitcoin chart since the last analysis? Definitely not! But the lack of any change here can be seen as an important clue. Let’s look at the facts.
For more than two months now, Bitcoin has been consolidating in a very wide range, set between $26,500 and $31,000. Unfortunately, the last two weeks have seen the price moving in the lower regions of the designated zone. This is all the more worrying because until recently only the wicks of candles reached there. Today this area is responsible for regular trading. Thus, there is no denying that Bitcoin is clearly weakening.
Nevertheless, the leading cryptocurrency continues to support the 100-day moving average, which, looking at it historically, has done an excellent job both as support and resistance. At the same time, we observe the MACD, which is attempting to make a bullish cross. Here, on the other hand, there is a distinct lack of momentum, so it may not have much impact on the price.
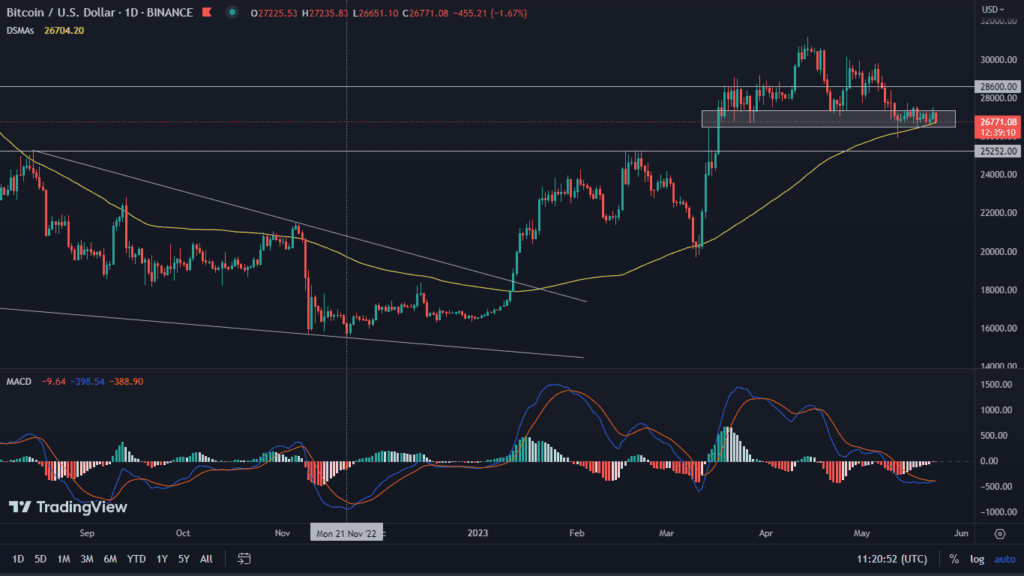
Therefore, if declines occur, the level of $25,250 is worth watching. This is where another strong area of support is located. Possible increases should result in a renewed attack on $28,600. Successful defeat of this zone should open the way towards $31,000.
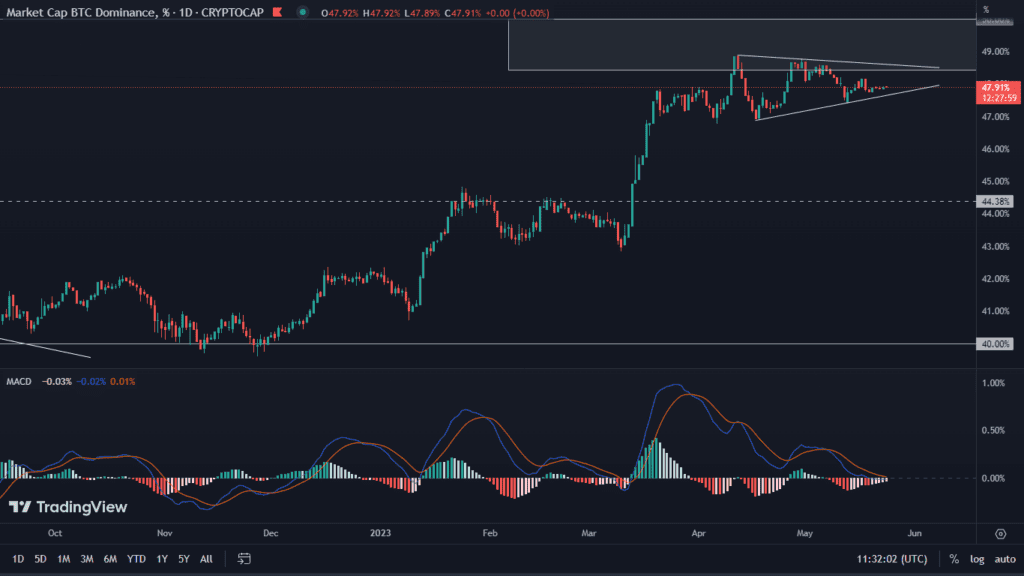
Bitcoin’s dominance is gaining strength
At the same time, Bitcoin’s dominance chart appears to be one of the most bullish. On it we see a consolidation, just below resistance, while constructing a clear symmetrical triangle. Such a formation usually heralds a continuation of the trend. MACD at the same time also looks very positive and can support the movement.
The condition of U.S. finances can affect cryptocurrency valuations
Taking the above into account, it can be assumed that Bitcoin is waiting for the right catalyst for further movement. There are many indications that such an event will appear around June 1. This is because that is when the deadline for a decision on the US debt limit passes. If it is not raised, the largest global economy could be in danger of technical bankruptcy. This could cause drastic drops in stock prices, which will certainly translate into global finance, as well as the cryptocurrency market. Certainly altcoins could suffer.
Will Bitcoin experience the same problems? It will undoubtedly experience high volatility. BTC will thus face the opportunity to once again prove its real value. However, these are assumptions for the so-called “black scenario”. Problems with raising the US debt limit have been observed quite often, but each time, there was a last-minute solution. It is highly likely that the same will happen this time.


