

As many as 13 strikes against resistance located at the USD 28,600 level have been scored by Bitcoin over the last 18 days. In theory, the more often it is touched, the weaker it becomes. So, is a breakout coming and after a long consolidation there will be an attack on higher ground?
Bitcoin on the monthly chart
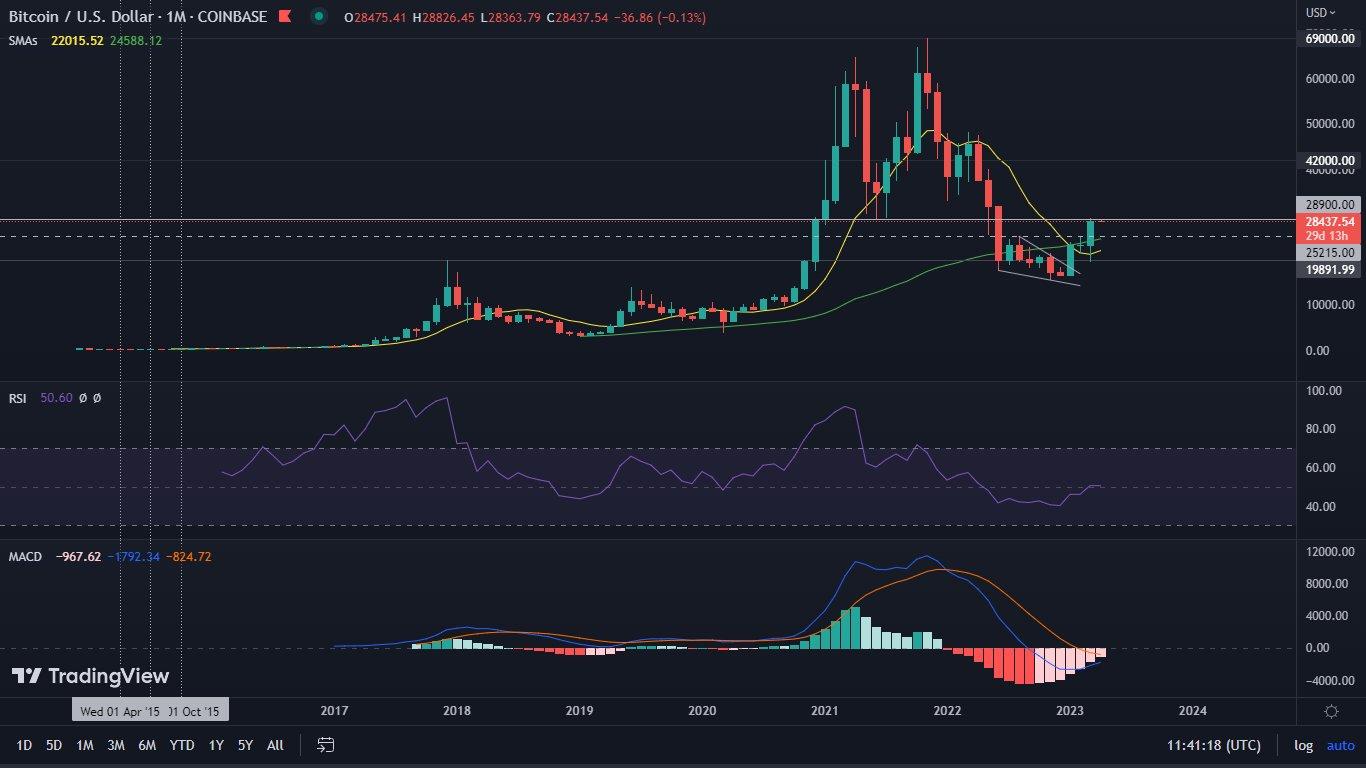
The chart of Bitcoin on the monthly interval is currently extremely bullish. Due to the fact that March has just ended, it is time to take a closer look at it.
What we see is, first and foremost, a further 23.1% increase in the price of BTC. In doing so, the RSI has managed to climb above the 50 level, indicating an advantage of bullish strength. Also bullish is the MACD, which may experience a positive cross in the near term. Interestingly, for the second time in a row, the price closed above the MA10 (yellow line). Historically, the breakout and maintenance of this level has resulted in its further respect. This represents a potential trigger for the next bull market. The MA20 (green line) also broke out.
However, bear in mind that in order to confirm a change in trend, it is necessary to wait for a higher low to be formed, followed by another higher peak. For this to be achieved, it may take many more months.
Bitcoin on a weekly chart
The weekly interval, on the other hand, sends very different signals. Bitcoin has made an increase of 0.7%. In doing so, it has maintained an RSI of 65, as well as a bullish MACD structure. However, volumes are currently declining. The RSI is continually constructing a bearish divergence and the OBV is following suit.

It is worth noting on this occasion two further factors that are now becoming clear warning signals. One is the stochastic RSI, which is constructing a second peak in the overbought zone. The other, however, is the ADX indicator, which has hardly reacted to this year’s movements in the BTC price.

Bitcoin on the daily chart
With that, we move on to the daily interval, where by far the most is happening. The first and key factor we consider in our analysis is volume. Ever since bitcoin made its breakthrough through the $25,200 level, the index has been on a continuous downward trend. This has not prevented the leading cryptocurrency from reaching a price of USD 28,600. However, the resistance proved so strong that the value of volumes fell to this year’s lows. On the one hand, we are seeing consolidation, which justifies the low turnover. Nevertheless, in order to overcome such an important band and successfully break through USD 30,000, it is worth expecting higher indicator bars, not only during the breakout, but also before it takes place.
This situation is accompanied by a very broad RSI divergence, which finds its beginning in the oversold zone. The MACD has made a bearish cross in recent days, but so far it has not had a significant impact on the current price action.

Another indicator worth considering is the OBV. Here, too, we are locally observing a bearish divergence. It is not strong and a sharp price breakout can easily negate it. Nevertheless, the fact of its existence is worth bearing in mind. The ADX completes the picture, which seems to be more worrying. With Bitcoin’s price above $23,000, this indicator formed its first peak. Now that the price is significantly higher, peak number two is being constructed, which in turn is lower. This means that the continuation of the trend is much weaker than it was before. This divergence could result in another pullback in price.

In our opinion, an attack on the USD 30,000 level seems possible. However, analyzing the indicators, we think that this level could be rejected, and that possible declines could lead the BTC price to test lower areas as support. Such a retracement of the price and thus the acquisition of liquidity could result in another attempt to attack the resistance, which could possibly be successful.


