

Just six days passed from the golden cross on the daily chart, to the appearance of the death cross on the weekly interval. For Bitcoin, this is an absolute novelty. To understand what it entails, we will look at similar events for the S&P500 index.
The inevitable has become a reality
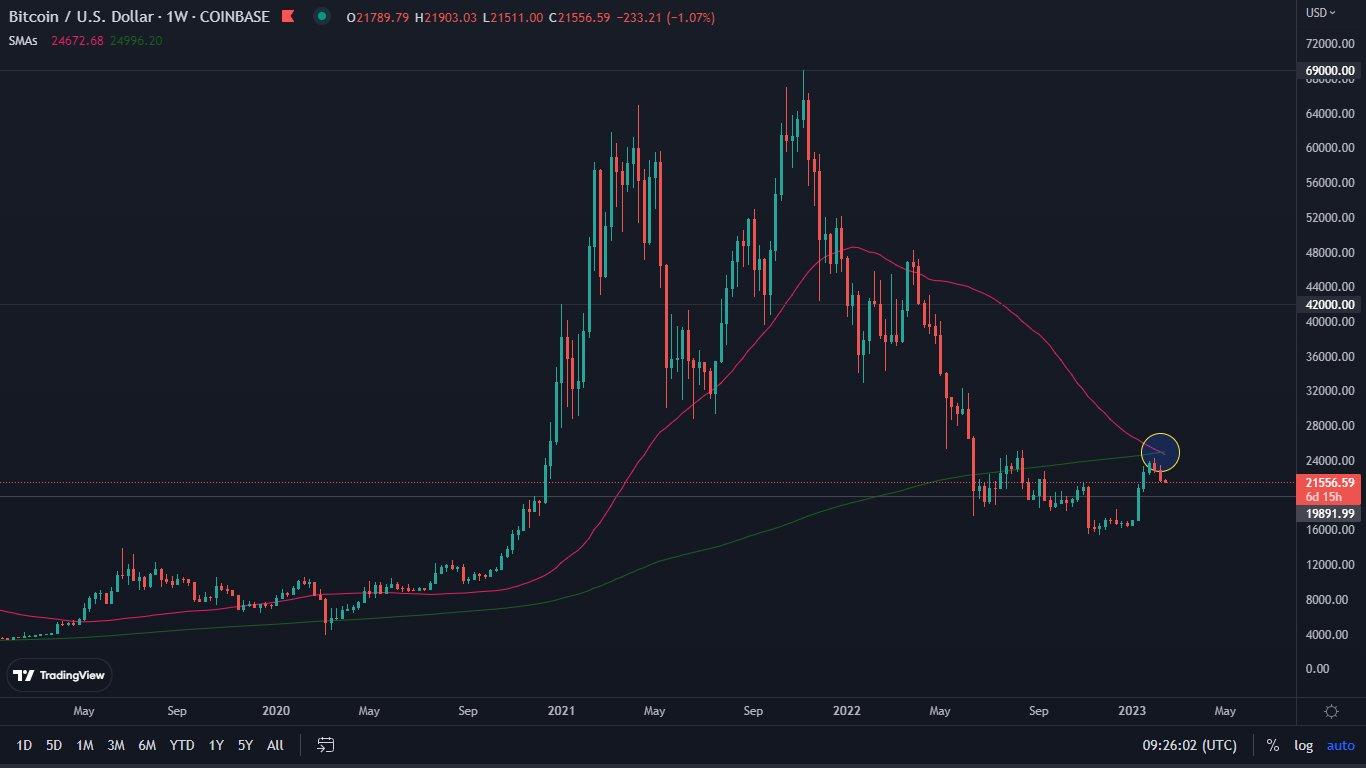
We traditionally begin our analysis by presenting the events on the weekly chart. What we observe is Bitcoin’s 5.0% decline. Thus, the price stopped at support, set at the level of $21,500. The result is that we see a played out bearish RSI divergence, which may continue to extend. Meanwhile, the turning point was confirmed on the Stochastic RSI. This has often meant slightly deeper declines. The MACD is also losing momentum, making it likely to be at a turning point. On the other hand, a positive sign is the RSI itself, which is still above the 50 level, an area whose defense is essential for further increases.

But by far the most important development here is the appearance of the long-awaited death cross between the 50-week and 200-week SMAs. This is taking place for the first time in history. It is therefore difficult to refer to the clear data. Therefore, it is worth looking at the effects of similar events in traditional markets.
Bitcoin in an unprecedented situation
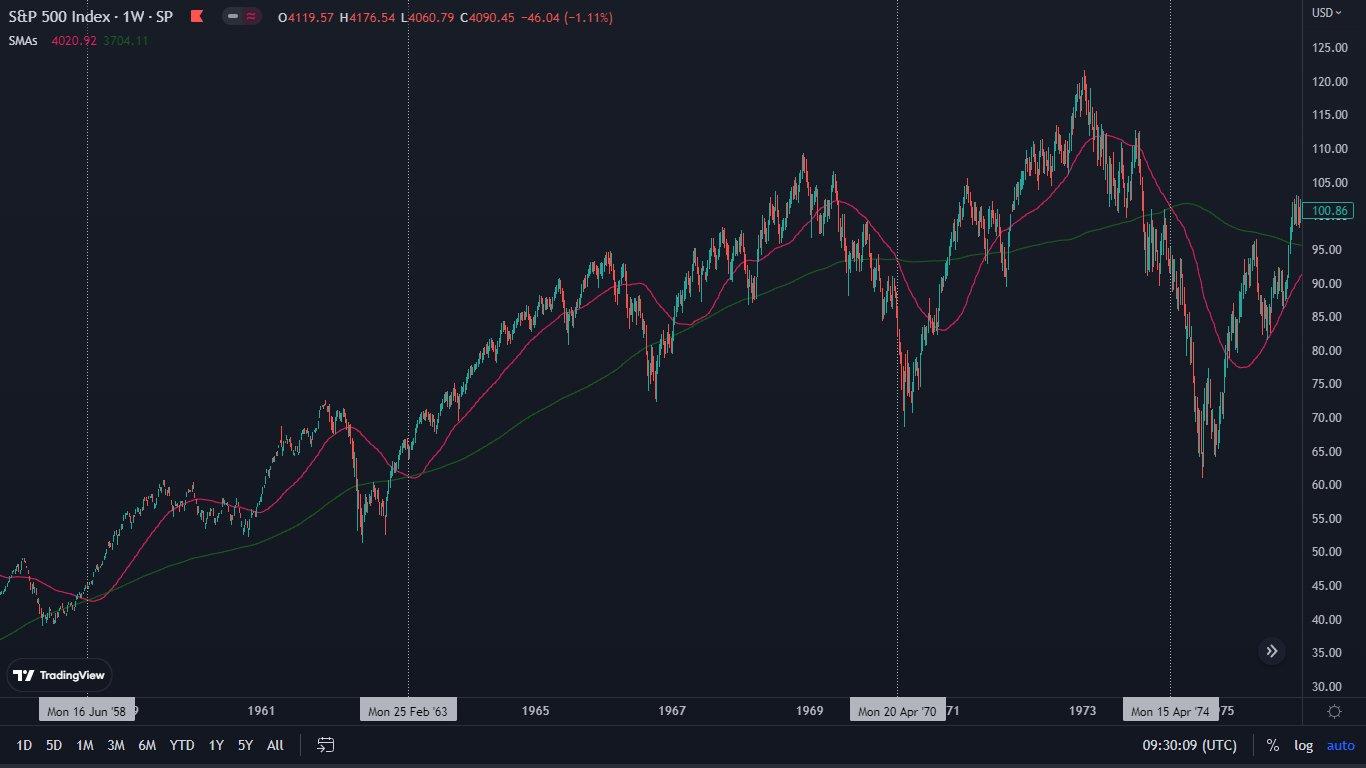
The reference point of the weekly death cross thus becomes the chart of the SPX index. Due to the fact that even here, this event is extremely rare, we will go into its deep history. It is presented as follows:
1958: +36% in 39 weeks,
1963: +65% in 301 weeks,
1970: -20% in 5 weeks,
1974: -35% in 24 weeks,
2001: -29% in 56 weeks,
2008: -29% in 20 weeks.
Using the above examples, we can see that in distant history, the death cross for the S&P500 index was a very bullish signal, leading to solid increases. However, this narrative changed at the turn of the 1970s. Since then, the event has regularly suggested a continuation of previously started downward movements and the SPX finally reaching a new multi-year low.
So can a similar situation happen on the Bitcoin chart? By all means, yes. However, excessive pessimism is not advisable. Looking at the current BTC price action, as well as the events that have taken place so far, for a new bottom to be reached, the occurrence of another, and very strong, black swan seems necessary.
Bitcoin on the daily chart
Meanwhile, a strong bullish RSI divergence is currently playing out on the daily chart. It is also supported by the MACD, which is moving towards a bullish cross. The stochastic RSI also looks healthy. It is currently in the process of leaving the oversold zone and heading upward. Volumes remain low in the process. However, given that BTC is consolidating in a wide band between $21,500 and $25,000, this is perfectly reasonable.

So what is likely to happen in the near future?
In addition to our designated price areas, it is also worth watching the moving averages. The 200-week SMA (pink line) indicates resistance, the overcoming of which is necessary for the continuation of increases. It currently coincides with the horizontal level of $25,000, which makes it likely to be difficult to break through.
The green line, on the other hand, is the 200-day SMA. She, on the other hand, has the right to determine support. It is located in the area defined by the CME gap. The appearance of Bitcoin in this zone is still highly likely.


