

For several years now, September for Bitcoin has been colloquially known as a black period. The last time the month closed in the green was in 2016. Since then, it has been listed in the statistics as a time of losses. So let’s see if there is a likelihood of breaking this all-time bad streak.
Bitcoin on the monthly chart
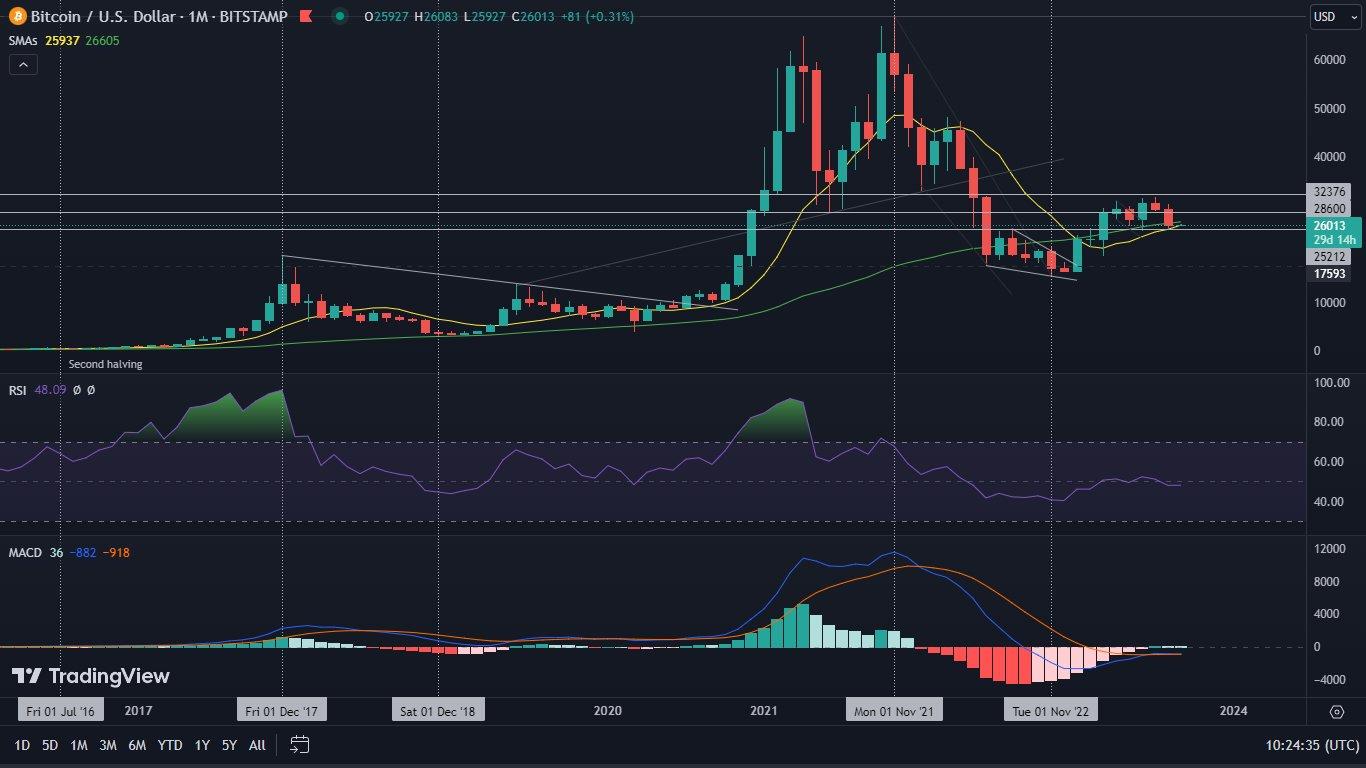
The start of a new month results in the need to look at the behavior of BTC on this particular time interval. Thus, we see that August resulted in a decline in Bitcoin’s value, amounting to 11.3%. This result does not inspire optimism. Moreover, this is the second red candle in a row, indicating the strength with which the cryptocurrency respects the resistance located at the level of $32,000.
The effect of this is that the RSI has fallen to the level of 48. The MACD, on the other hand, is losing momentum, while heading towards a bearish cross. What is interesting, however, is that this very indicator, through a bullish cross, has determined the local price peak so far.
What is surprising is Bitcoin’s loss of the 20-month moving average. Such a situation is a unique phenomenon. Each time the price of the leading cryptocurrency found its potential cyclical bottom and the MA20 was recovered, it provided support for further upward movements. Meanwhile, now the price is resting on MA10.
Summing up these facts, we can clearly see that selling pressure may still be building up.
Bitcoin on the weekly chart
The weekly chart looks a bit more optimistic, but in its case, we also see quite a few warning signals. It is with these that we will start.
Bitcoin recorded a decline of 0.5%. Formally not much. However, looking at the shape of the candle, we can draw more conclusions. This is because we see a high wick, drawn out almost to the level of $28,600, which is a clear horizontal resistance. To make matters worse, in the same area is the 200-week SMA, which is the psychological boundary between the bull and bear markets. Forcefully, it too has been confirmed as new resistance. The RSI, on the other hand, holds the 45 level, which we know favors bears.
The positive aspect, on the other hand, is the strong struggle to hold the $25,200 level. When we look at the chart from a further perspective, we can see how important this area is. Last week was the third in a row when the price decided to test it. The whole thing is complemented by a bullish RSI divergence.

Bitcoin on the daily chart – a possible scenario for further price action
Finally, we come to the daily chart, which is the only one that looks particularly bullish. We have been pointing out the bullish RSI divergence on it for quite some time now. It appears exactly at the same time when BTC touches the horizontal support at the level of $25,200.
Nevertheless, it is worth noting that despite another test of the support, the daily candles are closing lower and lower. This means that the strength of buyers is weakening, here selling pressure is increasing.
In our opinion, a false breakout may occur here. With the yellow dashed lines, we have marked a potential scenario, according to which further declines could result in a breakout of support and the divergence being completely embedded in an oversold trend. Such a scenario would give it particular strength. This could result in the so-called hunt for stop-losses, and thus the acquisition of liquidity before the upward breakout.


