The situation on the chart of the king of cryptocurrencies does not fill with optimism. Indeed, there are no signs of trend reversal, and in addition, the area near the 200-week moving average has become new resistance. What awaits BTC in the coming days?
$22,000 local peak
In an analysis a week ago, we noted a mild bearish divergence forming on the Bitcoin chart. Since then, we can see that a clear downward action has also emerged in connection with it. Bitcoin is struggling to hold the $20,000 level at the time of this writing. Looking at the construction of the RSI indicator, we can see that a possible decline could result in the formation of a bullish divergence. Such a scenario could strengthen the consolidation in the current area. Meanwhile, MACD is losing its momentum, which is definitely a negative sign.
On this occasion, it is worth focusing on the behavior of the Hash Ribbons indicator.
Recently, one could get the impression that the boundary moving averages were starting to move towards each other. This could have suggested that the period of capitulation of the miners is already coming to an end. However, as it turns out, this issue is not yet determined. Thus, we observe a progressive deviation, which in the context of the problems experienced by the mines, has the right to result in further weakening of BTC.

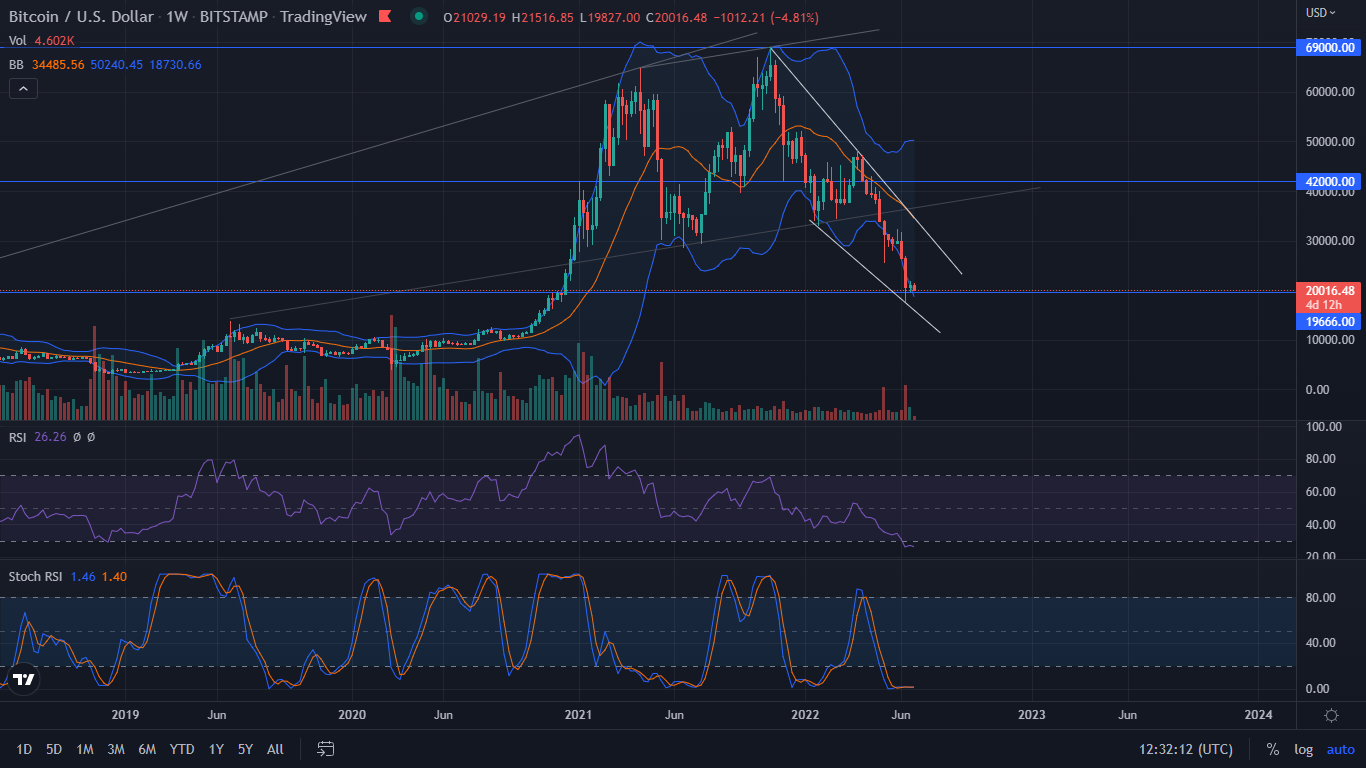
The weekly chart does not impress either
It would seem that in the face of such uncertainty, the chart on the weekly interval will bring more answers. Thus, we see that the past 7 days resulted in a close in the green. Unfortunately, the candle formed does not suggest a trend reversal. At the same time, the volume remains relatively low. The RSI does not show divergence. In turn, the lower Bollinger Band clearly bent down from the level of 20 thousand dollars. The only positive signal remains the Stochastic RSI, which indicates oversold, which in turn has the right to result in a gentle rebound, or consolidation.
Where to look for resistance and support levels?
When looking for levels for potential price rebounds during possible declines, it is worth to pay attention to the pennant forming on the chart (picture above). Its lower limit is determined in the vicinity of USD 16,000. However, the upward rally will be a fight to regain the 200-week moving average. It is currently located near USD 22,500. Its ascent is crucial for a possible trend reversal.
In the meantime, it’s worth noting that any moment now, bitcoin will experience the close of the month. It is a real rarity when such an event occurs below the 200-trend moving average. The last time a similar situation was recorded was in the second half of 2015. We will soon find out if this history will repeat itself.
Bitcoin’s dominance an indication for further market movements?
In the last material we highlighted a new chart. It is the dominance of Bitcoin over altcoins, excluding key stablecoins such as USDT, USDC, BUSD and DAI. On it we noticed a clear bullish divergence and the 50% level, which in our opinion had the right to become a support. As time has shown, this is exactly what happened. Currently, the divergence is triggering clear increases. It is also supported by the MACD indicator, which reinforces this rebound.

What is noteworthy is the fact that Bitcoin has been going up recently while the market is clearly going red. This chart structure could therefore be a warning signal.