The long-awaited volatility is finally visiting the cryptocurrency market. Significant bumps are recorded by many coins, including, of course, Bitcoin. Shiba Inu is also following suit. Let’s take a look at what’s happening on the charts.
Bitcoin on a weekly basis
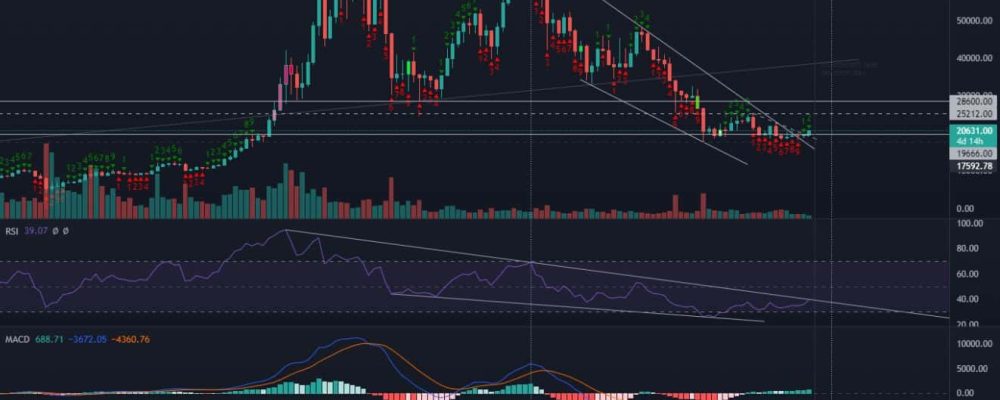
In the past week, we highlighted minor elements of the weekly chart that have the right to result in the beginning of Bitcoin’s rally. There was the bullish MACD, the TD Sequential indicator with 9 red candles, or even the previously observed bullish divergence, also present on the SPX chart.
It seems that we were absolutely right. Bitcoin has since managed to form the first green TD Sequential candle. In doing so, it has followed the traditional markets, which are also recording interesting increases. It is very important to note that as we are creating this analysis, BTC is reaching the RSI downtrend line, which in turn has been under for 93 weeks. Its breakthrough could result in a complete change of the market narrative from bearish to bullish. The question is whether conditions are actually emerging that could confirm such a development.
Bitcoin on the daily chart
The fantastic breakout, on the other hand, is presented to us by the daily chart. This is where, on Tuesday, October 25, Bitcoin broke out from under the local downtrend line (diagonal dashed line) and made a solid increase. The volume of this breakout remains at average levels. The MACD is of course bullish. However, the first sign of RSI divergence will appear. It is bearish this time. Nevertheless, it is expected to be maintained for a somewhat longer period of time.
There is a reasonable probability that the growth currently observed, once again, will not prove to be sustainable. All due to the interest rate decision, which is due on November 2. We have marked this day on the chart with a vertical solid line. The market expects further tightening of monetary policy and a rate hike of 75 basis points. Such conditions are not conducive to sustained increases in cryptocurrencies. Expect higher volatility then, and perhaps a reversal of the direction of the short-term trend.
Shiba Inu in the wake of Bitcoin
Bitcoin’s rapid growth has caused many smaller coins to follow in its footsteps. Among them is the Shiba Inu, which is attempting to break out of a long-term consolidation, located around $0.000010. At the time of writing this analysis, SHIB is clearly headed toward $0.000011. However, this move lacks momentum, which could emphasize volume. Nevertheless, the RSI and MACD remain bullish, drawing no clear divergence for the time being. For SHIB, the main target is to regain the $0.000012 level and retest it. Only after it is reached will it be possible to talk about a possible continuation of increases.
The dollar index leaves the markets room for action
Increases in the cryptocurrency market are a response to the weakening condition of the DXY index. We have repeatedly mentioned the essence of the inverse correlation in force here. Thus, we see that the dollar has broken the support line of the short-term trend and is moving towards the long-term line. This is accompanied by a bullish RSI divergence. It is worth watching the MACD, as the moment of contact with the trend line, may result in a return of the momentum of the indicator.


