Despite the fact that further decisions on the spot Bitcoin ETF are postponed, the price of the king of cryptocurrencies remains at very high levels. The chart is beginning to adopt a clear structure. Should it be read as an accumulation in an upward movement, or perhaps an ascending channel, with a bearish character? Let’s take a look at the indicators and check.
Bitcoin on the weekly chart
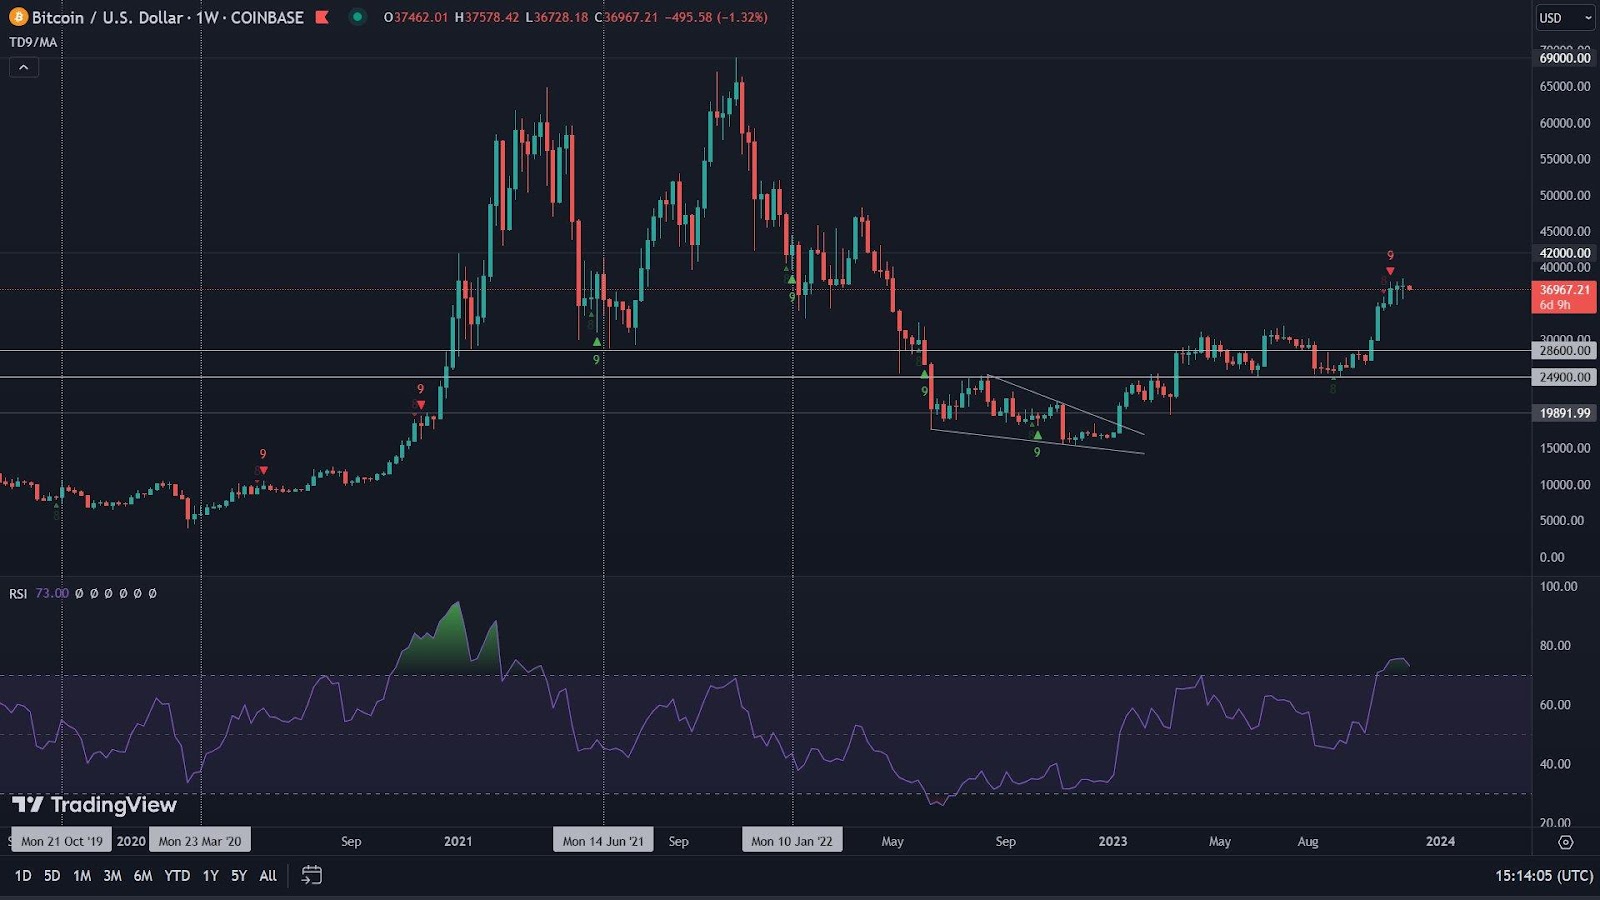
The weekly interval does not look particularly favorable for Bitcoin. On it we see increases of 0.2%. At the same time, the RSI remains in a healthy space, reaching the level of 75. Quite worrying, however, is the fact that the TD Sequential indicator is overstretched. We see on it already the eleventh upward candle in a row. Recall that the TD Sequential indicates potential regions of a possible trend reversal. However, it is worth remembering that for a correct assessment of the situation, one indicator is not enough.
Instead, its confirmation becomes the behavior of the Stochastic RSI, which for the third time in recent weeks is looking for a bearish crossover point. With few exceptions, this indicator has been a solid sign of trend fatigue.
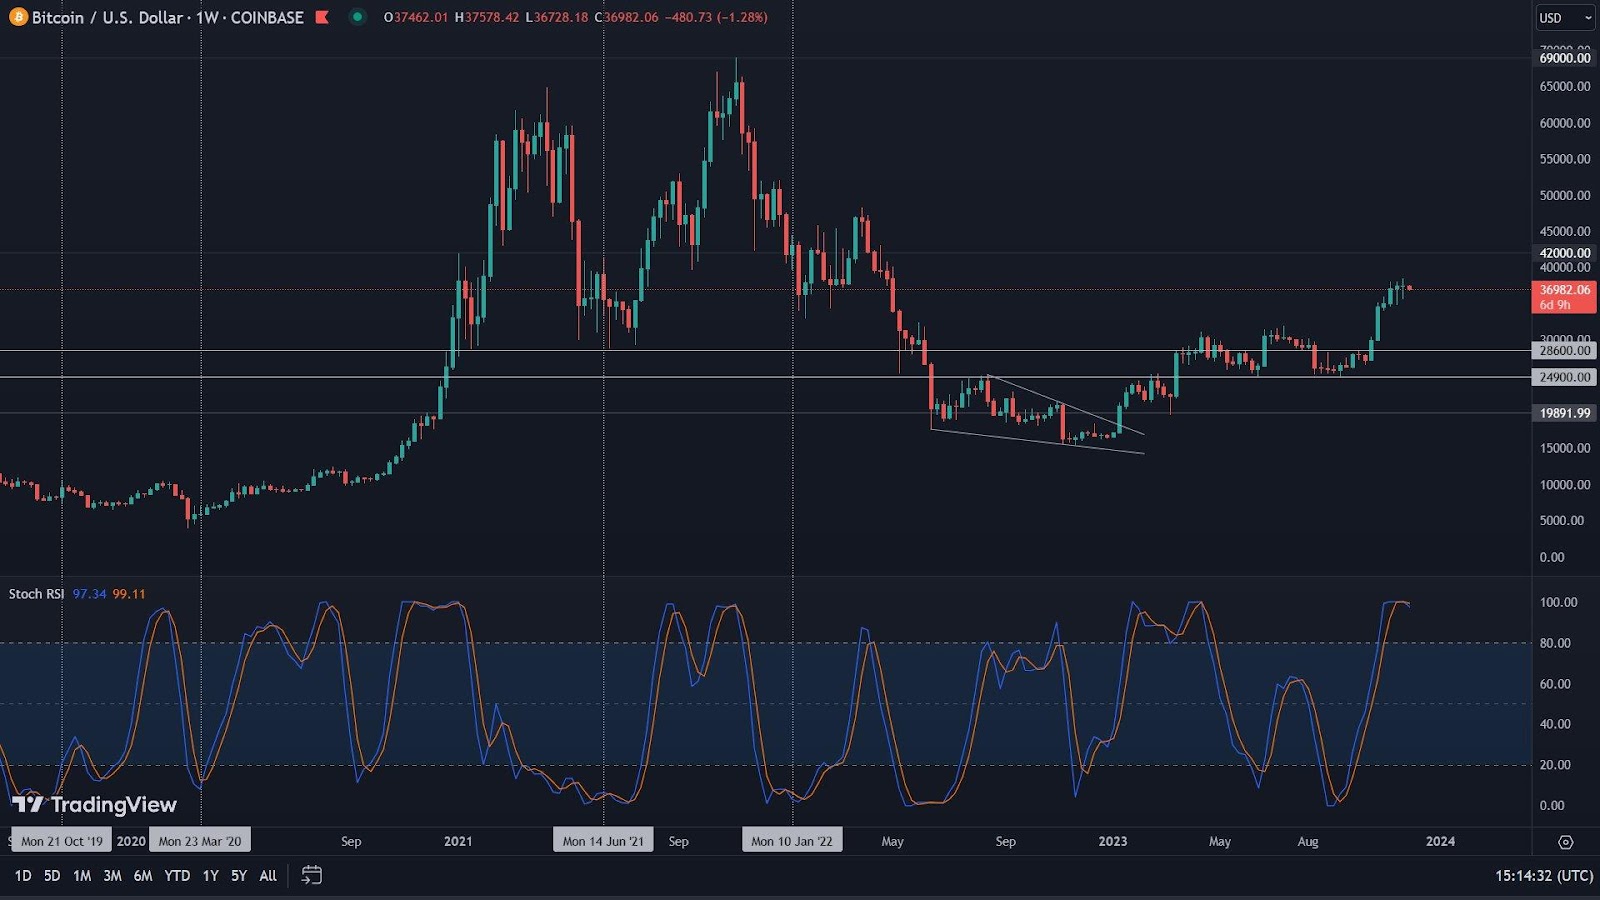
On this occasion, several price levels are worth watching. The first is horizontal support in the area of $32,300. Bitcoin’s price does not have to go that deep at all. Nevertheless, with possible declines, this area will be a real barrier that is unlikely to be broken through. Resistance, on the other hand, can be sought in the price band between $40,000 and $42,000. If bitcoin experiences another upward breakout, this is where it could establish a temporary local peak.
Bitcoin on the daily chart
There are many indications that Bitcoin is trying to gather strength for another upward move. Looking at the chart structure, we can see a potential ascending channel. However, it is irregular, making it difficult to consider it a reliable formation. At the same time, the RSI is moving from bearish to bullish divergence. We have marked only the first one on the chart. This is because we think that an upward breakout is highly likely. The result is that the price of Bitcoin may encounter resistance in the aforementioned zone, located between $40,000 and $42,000. We assume that the RSI will then construct a bearish divergence, based on three independent peaks and fully located in the overbought zone. Such a structure could lend strength to a potential subsequent correction. At the same time, it is worth noting the weakening volume, which, with simultaneous price increases, does not inspire optimism.
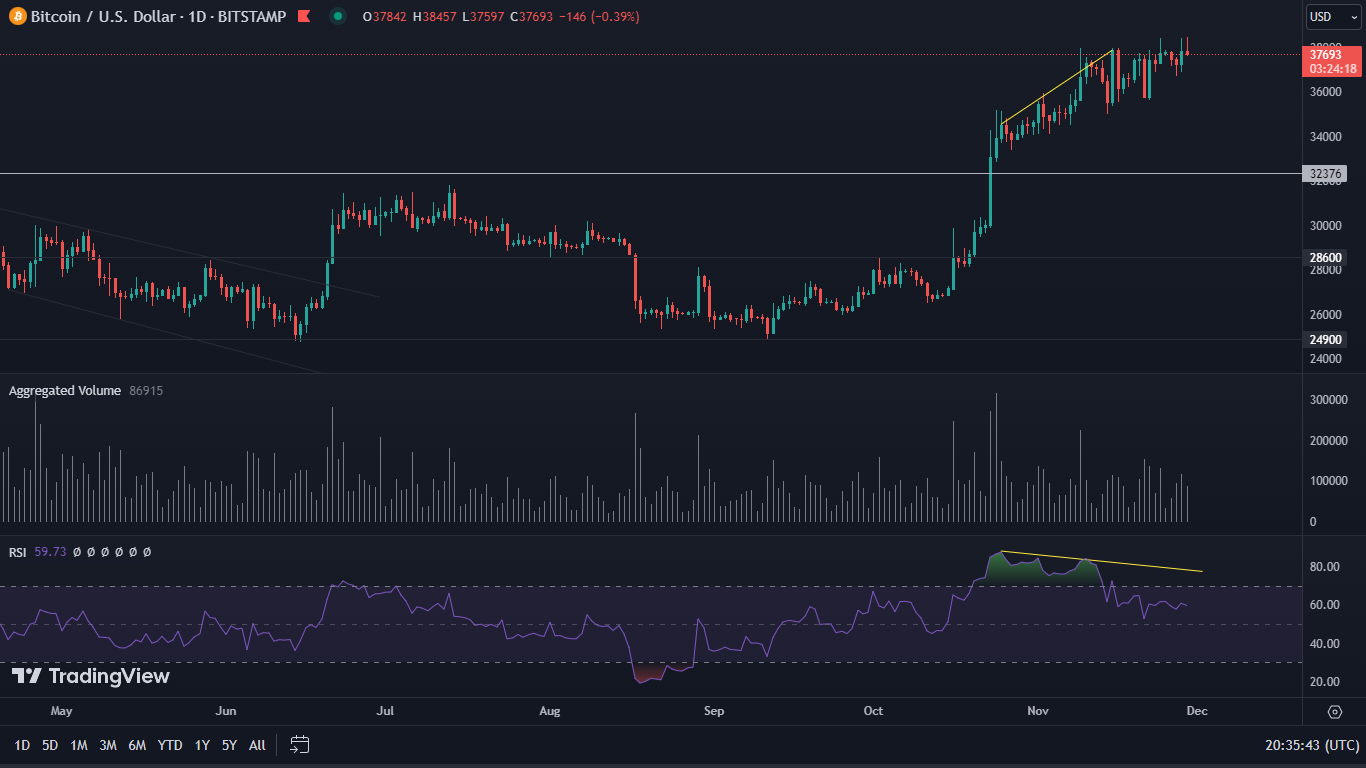
We can also see an interesting situation with regard to the ADX indicator. He tells us whether the ongoing trend is one of strength or not. We can see that at the moment there is a reset of it. The price, on the other hand, is holding high. This may result in another upward movement, but then it is worth expecting another unfavorable divergence.

Capital does not stop flowing in
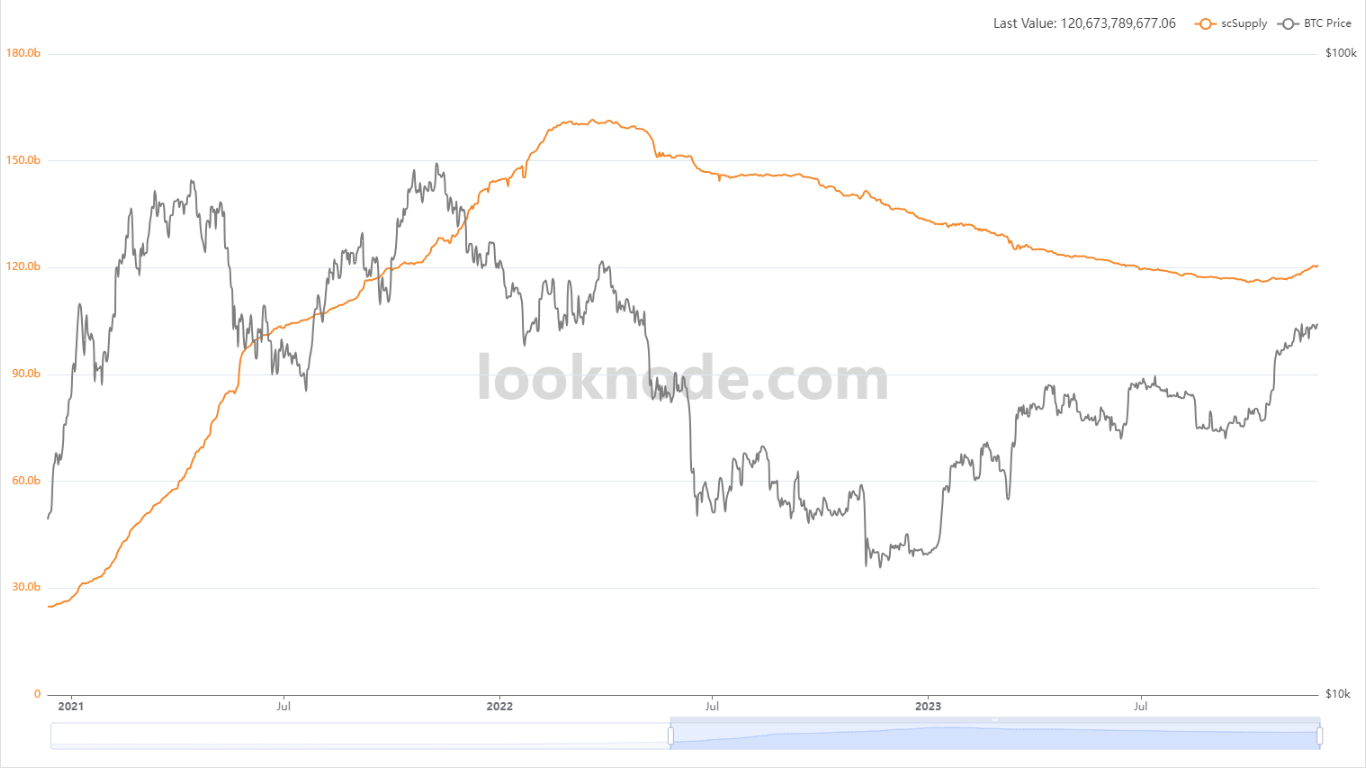
Using data provided by the Looknode.com platform, we note that capital continues to flow into the cryptocurrency market. The indicator of stablecoin’s circulating value suggests that the market has recently made a rebound from the bottom. It is possible that this was the bottom of the cycle. The effect of this is that stablecoins are increasing. This, in turn, projects a clear increase in the price of Bitcoin, which in the long term should maintain its trend.